Slide 32 of 33 from Marketing Plan Presentation Template
Marketing Efforts KPI Slide with Dashboard Data Charts
Marketing Efforts KPI Slide
- Chart
- Bar Horizontal
- Kpi Reporting Slide
- 16:9
- 100% Editable
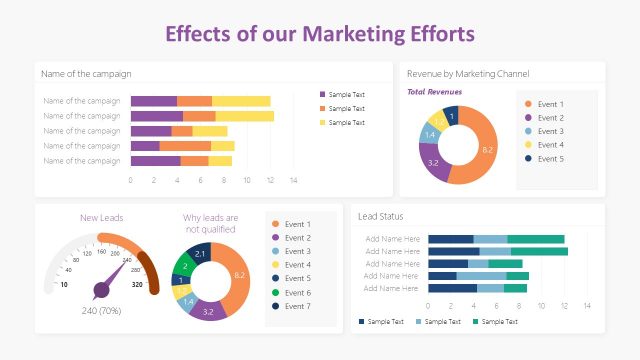
The Marketing Efforts KPI slide from the Marketing Plan Presentation Template offers a clear visualization of campaign performance and lead qualification metrics. This slide layout uses editable shapes and vector icons to display horizontal bar charts, pie charts, and gauge charts, making it suitable for business presentations focused on KPI tracking and marketing strategy evaluation. It integrates well within slide decks aimed at summarizing marketing efforts and improving lead management.
What’s on This Slide
The slide features a structured layout divided into four sections. The top left section displays a horizontal bar chart with five bars representing different campaigns, labeled 'Name of the campaign.' The top right section contains a pie chart titled 'Why leads are not qualified.' Below, the left section shows a gauge chart indicating 'New Leads' with a needle pointing to 240. The bottom right section includes a horizontal bar chart labeled 'Lead Status' with five bars. Text placeholders are present for campaign names, lead reasons, and lead statuses, aligned appropriately within each section.
How to Use It
This layout serves to present key performance indicators related to marketing efforts. It fits into a presentation sequence after discussing marketing strategies and before analyzing results. Use this slide to summarize campaign performance, lead qualification issues, and overall lead status. It is suitable for marketing managers to track effectiveness and identify areas for improvement in their campaigns.
Text Placeholders & Capacity
Keep your copy within these limits so it fits without resizing. Node labels can accommodate roughly 20 characters each.
| Placeholder | Count | Max characters (approx.) |
|---|---|---|
| Chart title | 1 | 30 |
| Item heading | 5 | 20 |
| Item body | 5 | 30 |
| Item heading | 7 | 20 |
Slide Keywords
Download unlimited PowerPoint templates, charts and graphics for your presentations with our annual plan.
DOWNLOADReturn to Marketing Plan Presentation Template.