Slide 31 of 33 from Marketing Plan Presentation Template
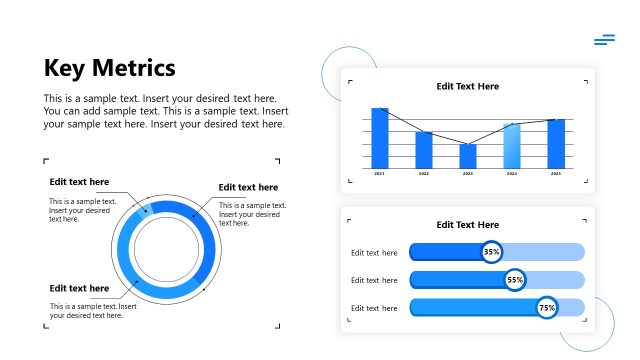
Key Marketing Metrics Dashboard with Data Visualizations
Key Marketing Metrics Dashboard for Analysis
- Chart
- Dashboard Composite
- Kpi Reporting Slide
- 16:9
- 100% Editable
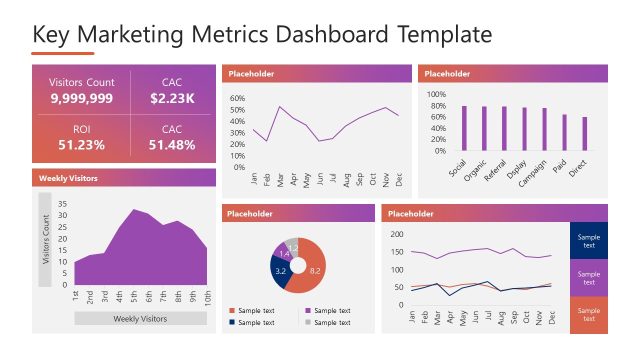
The Key Marketing Metrics Dashboard slide from the Marketing Plan Presentation Template offers a structured layout ideal for summarizing marketing KPIs. This slide integrates editable charts and text placeholders to display visitor counts, CAC, ROI, and trend analyses, supporting clear data-driven discussions in business presentations or pitch deck templates.
What’s on This Slide
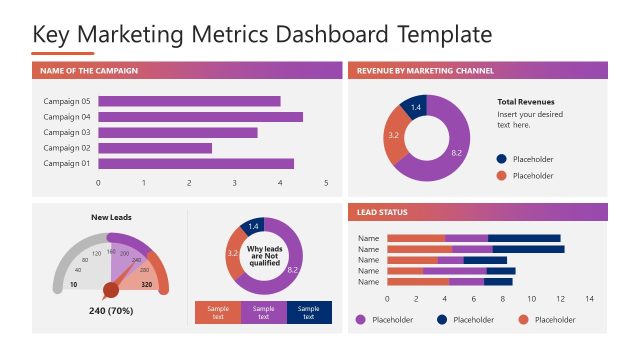
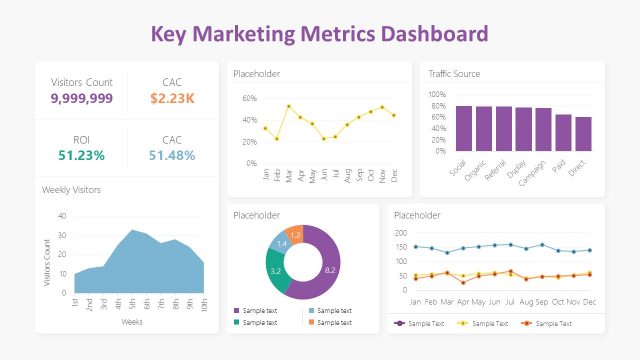
The layout features a grid structure divided into six sections. The top row contains three sections: the left section displays key metrics like Visitors Count, CAC, and ROI with text placeholders for values. The middle section includes a line chart showing a trend over time, while the right section features a bar chart with categories. The bottom row has a title for Weekly Visitors, a line chart, a pie chart, and another line chart. Each section is visually distinct, with placeholders for text and charts, maintaining a consistent color scheme throughout.
How to Use It
This layout serves as a dashboard for presenting key marketing metrics, making it suitable for performance reviews or strategy meetings. It fits well in a sequence after problem identification and before strategic recommendations. This structure is useful for marketing teams to summarize data on visitor counts, ROI, and customer acquisition costs, allowing for quick insights into marketing effectiveness and areas for improvement.
Text Placeholders & Capacity
Keep your copy within these limits so it fits without resizing. Node labels can accommodate around 20 characters each.
| Placeholder | Count | Max characters (approx.) |
|---|---|---|
| Slide title | 1 | 30 |
| Item heading | 6 | 20 |
| Item body | 6 | 50 |
Slide Keywords
Download unlimited PowerPoint templates, charts and graphics for your presentations with our annual plan.
DOWNLOADReturn to Marketing Plan Presentation Template.