Slide 12 of 15 from Light Business PowerPoint Template
Minimalistic Bar Chart Slide Design for PowerPoint
Bar Chart Slide for Business Presentations
- Chart
- Bar Vertical
- Evaluation Slide
- 16:9
- 100% Editable
The Bar Chart slide from the Light Business PowerPoint Template offers a clear visualization of financial performance and market trends using editable slides with vector icons. This layout is ideal for business presentations focused on sales growth and quarterly reviews, enabling effective communication of data over time within a professional slide deck.
What’s on This Slide
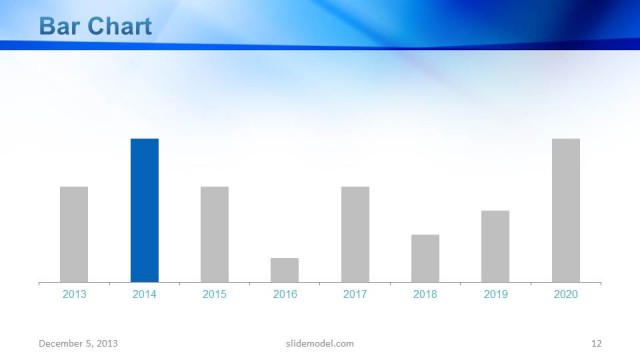
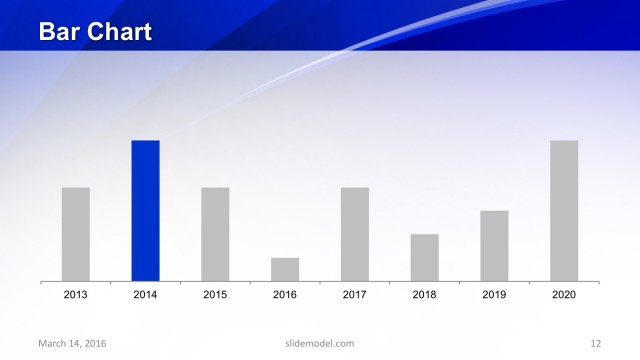
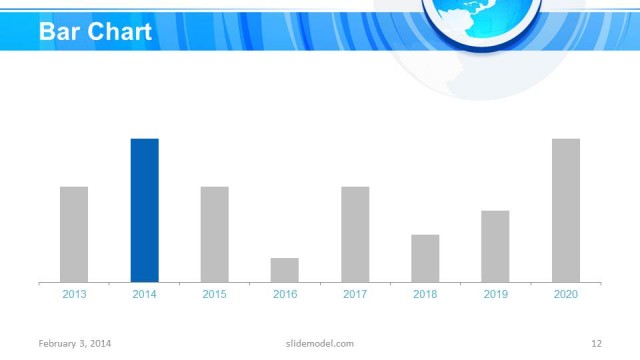
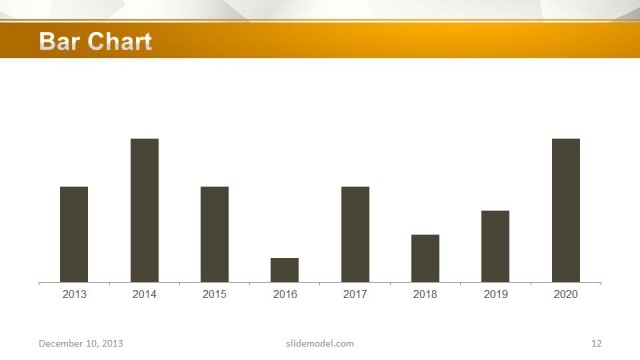
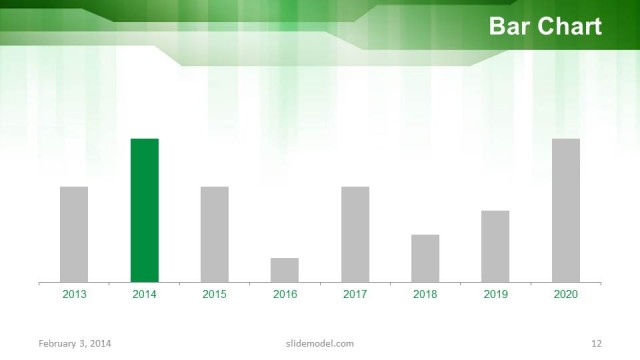
The slide features a bar chart positioned centrally, displaying data across the years 2013 to 2020. The chart has a prominent blue bar for the year 2014, while other years are represented with gray bars. The x-axis is labeled with the years, and the y-axis indicates the values, although specific numbers are not shown. A title is placed at the top left, with a larger font size, while a footer at the bottom includes the date and source. The background features a light blue gradient with flowing shapes, enhancing visual appeal.
How to Use It
This layout serves to present quantitative data comparisons over time, making it suitable for financial reports or performance reviews. It fits well in a sequence following a problem statement, allowing for a clear illustration of trends or results. Businesses can use this slide to showcase sales growth, market analysis, or project milestones, effectively communicating key metrics to stakeholders. It is particularly useful in quarterly business reviews or annual reports to highlight achievements.
Text Placeholders & Capacity
Keep your copy within these limits so it fits without resizing. Chart title and axis labels have limited space, roughly 15-20 characters each.
| Placeholder | Count | Max characters (approx.) |
|---|---|---|
| Chart title | 1 | 20 |
| Axis label | 2 | 15 |
| Footer | 1 | 30 |
Slide Keywords
Download unlimited PowerPoint templates, charts and graphics for your presentations with our annual plan.
DOWNLOADReturn to Light Business PowerPoint Template.