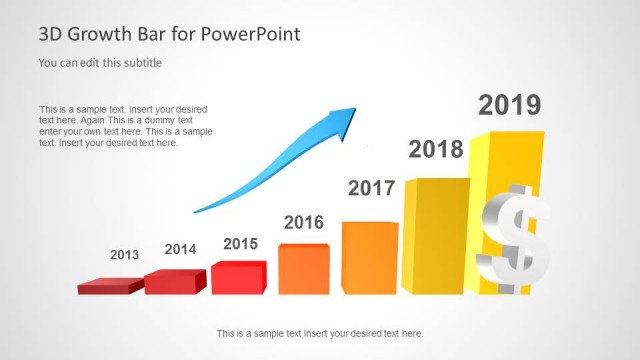
Slide 5 of 5 from Growth & Decay PowerPoint Template
6100-01-economic-growth-and-decay-5
Growth and Decline Chart Slide
- Chart
- Bar Vertical
- Evaluation Slide
- 16:9
- 100% Editable
The Growth and Decline Chart slide from the Growth & Decay PowerPoint Template offers a clear visual comparison of financial trends using editable slides with vertical bar charts and vector icons. This layout supports business presentations focused on economic trend analysis and operational assessments, providing a structured way to highlight changes in performance over time within a corporate presentation or pitch deck template.
What’s on This Slide
The slide features a left-aligned graphic of stacked coins with a downward arrow inside a circular shape, representing decay. To the right, there is a vertical bar chart with red bars indicating values from 0 to 6 across the years 2013 to 2018. The chart has a clear visual hierarchy, with the years labeled along the bottom. There are three text placeholders: one above the graphic, one below the chart, and one below the title, all centered. The background is a light gradient, enhancing the overall presentation.
How to Use It
This layout serves as a comparison between growth and decay, suitable for financial presentations. It fits well at the end of a presentation to summarize key data points. This structure is applicable in business contexts such as financial performance reviews, economic forecasts, or operational assessments. The bar chart effectively illustrates trends over time, making it ideal for highlighting declines in performance or revenue.
Text Placeholders & Capacity
Keep your copy within these limits so it fits without resizing. Body slots can hold roughly 15-20 words each.
| Placeholder | Count | Max characters (approx.) |
|---|---|---|
| Slide title | 1 | 30 |
| Subtitle | 1 | 50 |
| Body paragraph | 3 | 100 |