Slide 2 of 5 from Growth & Decay PowerPoint Template
6100-01-economic-growth-and-decay-2
Coin Stack Comparison Slide for Growth & Decay
- Diagram
- Comparison Split
- Evaluation Slide
- 16:9
- 100% Editable
The Coin Stack Comparison slide from the Growth & Decay PowerPoint Template offers a clear visual tool for illustrating financial growth and investment analysis. This slide layout uses editable shapes and vector icons to depict revenue trends effectively, making it suitable for business presentations and pitch deck templates focused on financial data comparison.
What’s on This Slide
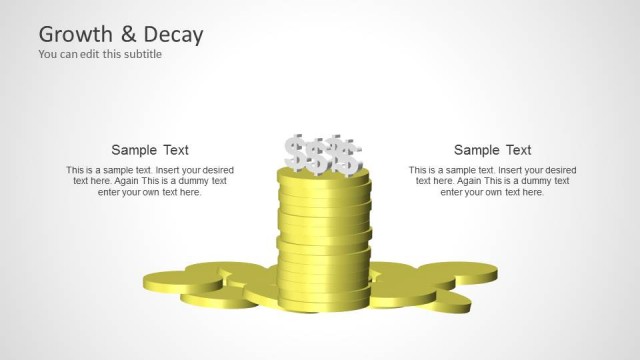
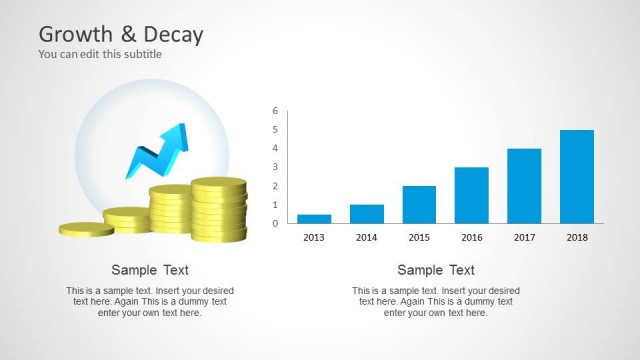
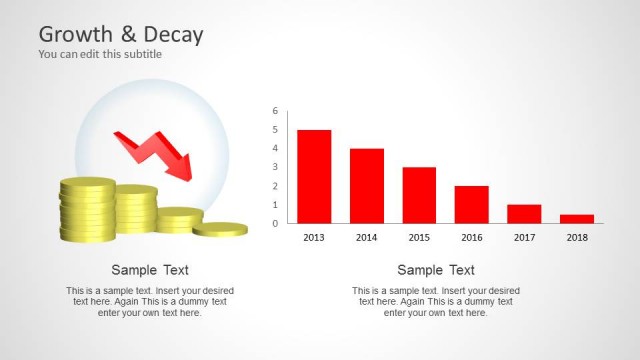
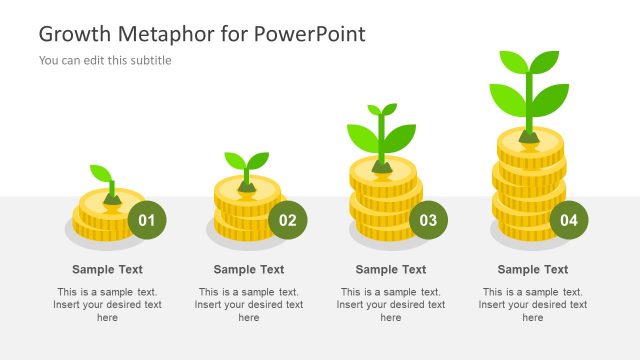
The layout features four stacks of coins arranged horizontally from left to right. Each stack is topped with a dollar sign icon, emphasizing financial themes. The first stack is the smallest, gradually increasing in height and size towards the right. Below each stack, there are text placeholders aligned centrally, allowing for descriptions or data related to each stack. The background is a light gradient, enhancing the visual focus on the coin stacks. The overall composition is clean and structured, with a clear visual hierarchy.
How to Use It
This layout serves as a comparison tool for illustrating financial growth or decay through stacked coin visuals. It fits well in a presentation sequence following a problem statement, providing a visual representation of financial data. Scenarios include comparing revenue growth across quarters or visualizing investment returns. The clear progression from smaller to larger stacks aids in conveying the concept of growth effectively.
Text Placeholders & Capacity
Keep your copy within these limits so it fits without resizing. Node body slots can hold about 6-8 words each.
| Placeholder | Count | Max characters (approx.) |
|---|---|---|
| Item body | 4 | 40 |