Slide 4 of 5 from Growth & Decay PowerPoint Template
6100-01-economic-growth-and-decay-4
Growth and Decay PowerPoint Slide
- Chart
- Bar Vertical
- Evaluation Slide
- 16:9
- 100% Editable
The Growth and Decay Chart slide from the Growth & Decay PowerPoint Template offers a clear visual comparison of financial performance over time using editable slides. Featuring a vertical bar chart alongside vector icons, this layout supports business presentations focused on market trends and investment growth analysis.
What’s on This Slide
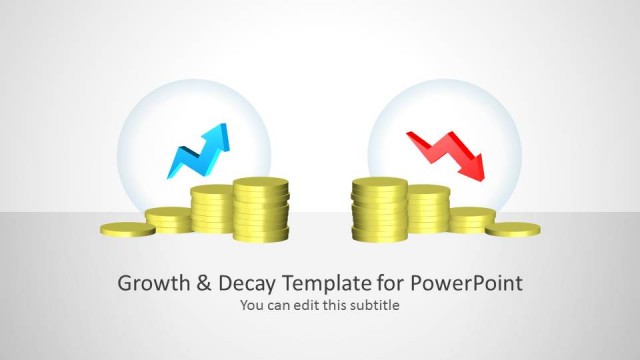
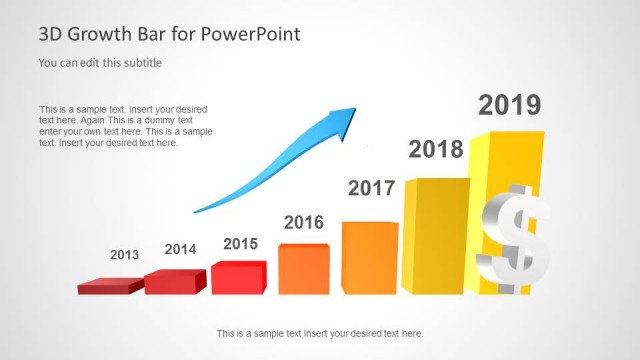
The layout features a left section with a stack of gold coins and an upward arrow inside a circular shape. The right section contains a vertical bar chart displaying data from 2013 to 2018. The chart has five bars, with the tallest representing 2018. Text placeholders are located below the title and subtitle, as well as beneath the chart, aligned centrally. The overall composition is balanced, with the coin stack and chart visually separated by a light background, enhancing clarity and focus on the data.
How to Use It
This layout serves as a comparative analysis of growth and decay over time, ideal for financial presentations. It fits well after a problem-framing slide, transitioning into data visualization. Suitable scenarios include presenting financial performance, analyzing market trends, or discussing investment growth. The layout can be adapted for various business contexts where growth metrics are essential.
Text Placeholders & Capacity
Keep your copy within these limits so it fits without resizing. Body slots can hold roughly 20-30 words each.
| Placeholder | Count | Max characters (approx.) |
|---|---|---|
| Slide title | 1 | 30 |
| Subtitle | 1 | 40 |
| Item heading | 5 | 10 |
| Body paragraph | 3 | 150 |