Slide 1 of 2 from Greiner’s Curve for PowerPoint
Greiner’s Curve PowerPoint Template
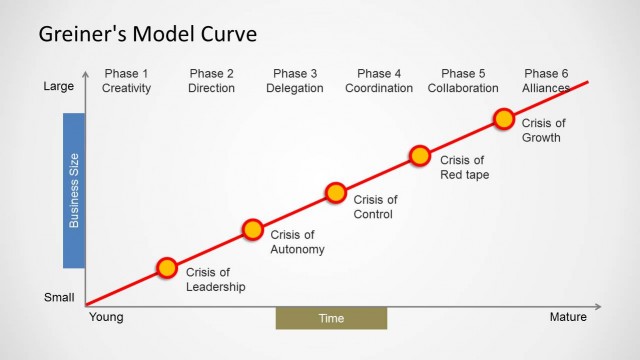
Greiner's Growth Model Curve for PowerPoint
- Diagram
- Process Flow
- Strategic Analysis Slide
- 16:9
- 100% Editable
The Greiner's Growth Model Curve slide from the Greiner’s Curve for PowerPoint template provides a clear diagrammatic view of organizational growth phases over time. This slide layout is ideal for business presentation decks focused on leadership strategy and organizational development, featuring editable shapes and vector icons to highlight key growth crises. It supports strategic analysis by visually mapping business size progression, making it a practical choice for corporate presentations and business development training sessions.
What’s on This Slide
The slide features a growth curve diagram with a horizontal axis labeled 'Time' and a vertical axis labeled 'Business Size.' The curve rises from the bottom left to the top right, indicating growth phases. Six phases are marked along the curve, with labels positioned above each phase. Star-shaped markers denote crises occurring at specific points. Text placeholders exist for the title and phase labels, aligned centrally and above the curve. The background is light, enhancing visual clarity, while the curve and labels are in contrasting colors for emphasis.
How to Use It
This layout serves as a visual representation of Greiner's growth model, illustrating the relationship between business size and time across six phases. It is suitable for presentations on organizational growth and strategy, particularly in leadership contexts. This diagram can follow a problem-framing slide, helping to outline growth challenges and crises. It is useful for discussing business development stages and associated risks, making it applicable in strategic planning sessions and leadership training.
Text Placeholders & Capacity
Keep your copy within these limits so it fits without resizing. Node labels can accommodate roughly 2-3 words each.
| Placeholder | Count | Max characters (approx.) |
|---|---|---|
| Slide title | 1 | 30 |
| Item heading | 6 | 20 |
| Callout | 5 | 20 |
Slide Keywords
Download unlimited PowerPoint templates, charts and graphics for your presentations with our annual plan.
DOWNLOADReturn to Greiner’s Curve for PowerPoint.