Slide 3 of 3 from S-Curves for PowerPoint
6121-02-s-curve-3
S-Curve Diagram for PowerPoint
- Diagram
- Other
- Process Slide
- 16:9
- 100% Editable
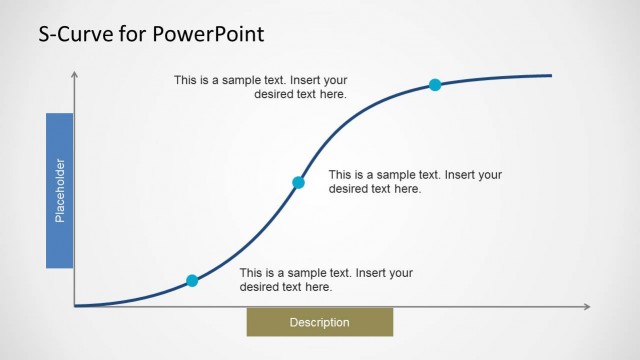
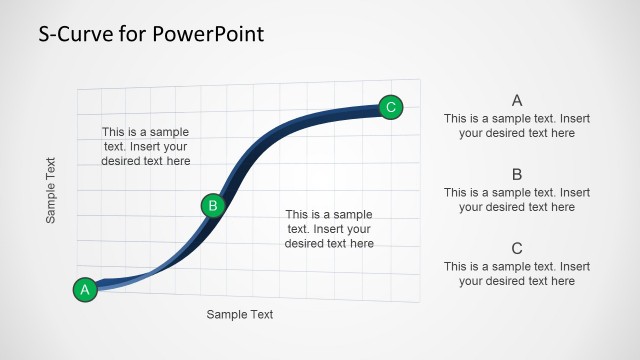
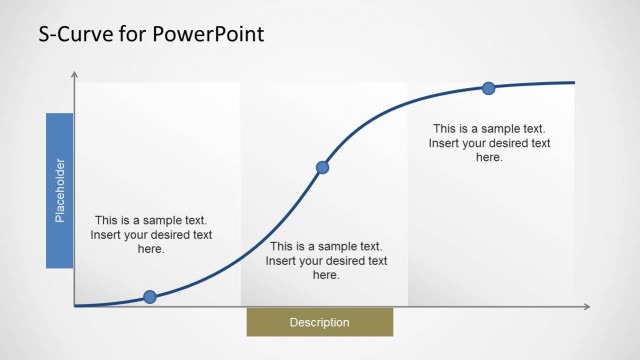
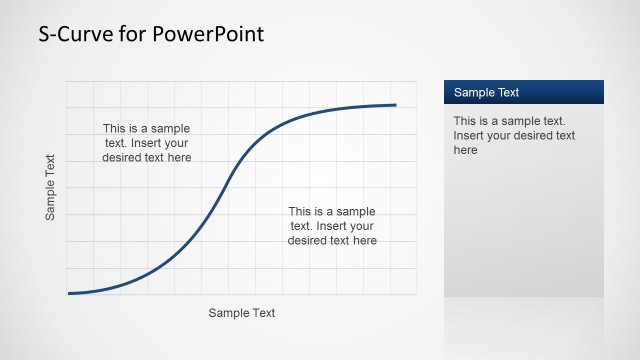
The S-Curve Diagram with Points slide from the S-Curves for PowerPoint template offers a clear visual tool for illustrating product adoption stages and market growth analysis. Featuring editable shapes and a structured layout, this slide supports business presentations by simplifying complex project lifecycle data. Its design integrates well into slide decks focused on corporate presentation or pitch deck templates, enhancing communication of performance trends and strategic insights.
What’s on This Slide
The slide features an S-curve diagram positioned centrally, with a blue line representing the curve. Six labeled points (Point 1 to Point 6) are marked along the curve, with varying colors for emphasis. A dashed line connects some points to indicate progression. To the right, there is a text placeholder box for additional information, aligned vertically. The background is light gray, enhancing visibility. The overall layout is structured, with a clear visual hierarchy emphasizing the curve and its points, while the text placeholder is distinct and separate.
How to Use It
This layout serves as a visual representation of growth or performance over time, ideal for illustrating concepts such as product adoption or project milestones. It fits well in a presentation sequence following problem identification and before strategic planning. Business scenarios include showcasing market trends, product lifecycle stages, or performance metrics. The diagram effectively communicates complex data in a simplified manner, making it suitable for various business contexts.
Text Placeholders & Capacity
Keep your copy within these limits so it fits without resizing. Body slots can hold about 20-30 words each.
| Placeholder | Count | Max characters (approx.) |
|---|---|---|
| Slide title | 1 | 30 |
| Item heading | 6 | 10 |
| Body paragraph | 1 | 150 |
Slide Keywords
Download unlimited PowerPoint templates, charts and graphics for your presentations with our annual plan.
DOWNLOADReturn to S-Curves for PowerPoint.