Slide 1 of 2 from Greiner's Growth Model Curve for PowerPoint
Greiner’s curve template for PowerPoint
Greiner's Growth Model Curve for PowerPoint
- Diagram
- Other
- Concept Explanation Slide
- 16:9
- 100% Editable
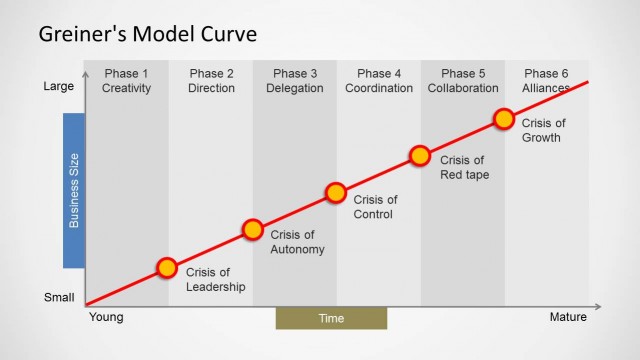
The Greiner's Growth Model Curve slide from the Greiner’s Growth Model Curve for PowerPoint template visually explains key phases of business growth and crises using editable shapes and vector icons. This diagram slide is ideal for corporate presentations, strategic planning, and business development workshops, providing a clear framework for illustrating organizational evolution over time within professional slide templates.
What’s on This Slide
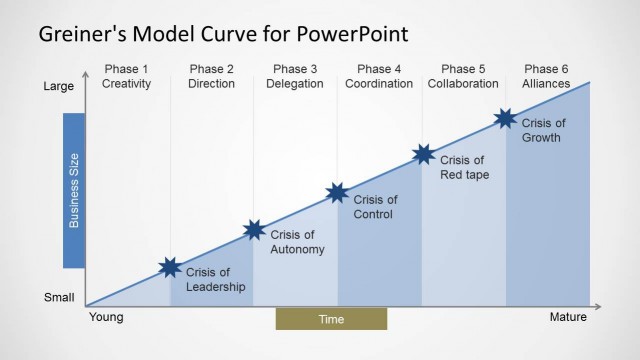
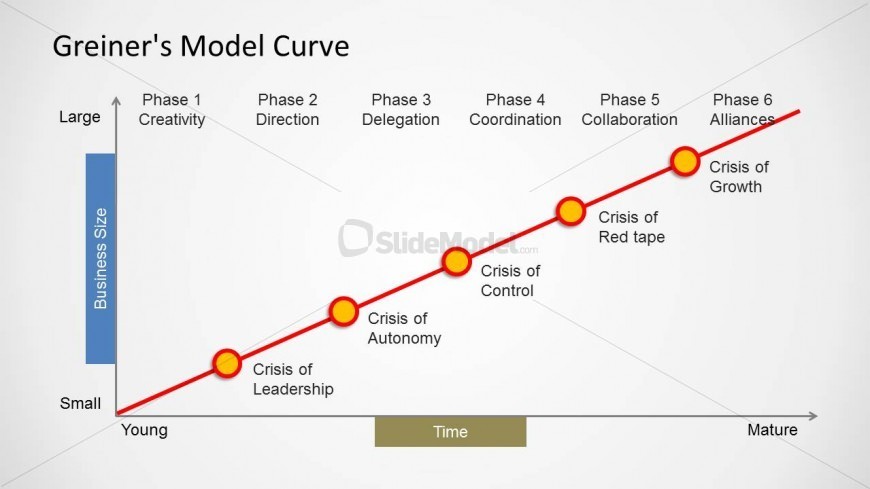
The slide features a diagram illustrating Greiner's Growth Model Curve. It includes a diagonal line representing growth over time, with six labeled phases: Creativity, Direction, Delegation, Coordination, Collaboration, and Alliances. Each phase has a corresponding crisis marker positioned along the curve. The vertical axis is labeled 'Business Size' and the horizontal axis is labeled 'Time.' Circular nodes indicate phases, with crisis labels placed below the curve. Text placeholders exist for the title and axis labels, aligned at the top and sides, respectively.
How to Use It
This layout serves as a visual representation of organizational growth stages and associated crises. It fits within a presentation discussing business development strategies or growth models. Suitable for consultants and executives, this diagram can illustrate the evolution of a company through various phases. It is effective for workshops, strategy meetings, or educational sessions focused on business growth and management challenges.
Text Placeholders & Capacity
Keep your copy within these limits so it fits without resizing. Node labels can accommodate about 20 characters each.
| Placeholder | Count | Max characters (approx.) |
|---|---|---|
| Slide title | 1 | 30 |
| Item heading | 6 | 20 |
| Item body | 5 | 30 |
| Axis label | 2 | 20 |
Slide Keywords
Download unlimited PowerPoint templates, charts and graphics for your presentations with our annual plan.
DOWNLOADReturn to Greiner's Growth Model Curve for PowerPoint.