Slide 7 of 12 from Global Shipping PowerPoint Template
Performance Slide with Data Chart – Global Shipping Layout
Performance Metrics for Global Shipping
- Chart
- Bar Vertical
- Kpi Reporting Slide
- 16:9
- 100% Editable
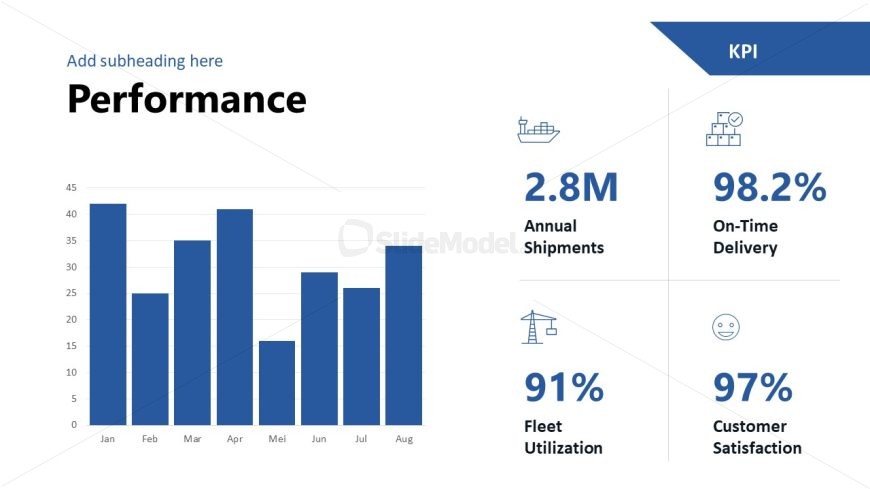
The Performance Metrics Chart slide from the Global Shipping PowerPoint Template offers a clear layout for presenting key shipment KPIs using editable slides with vector icons and a vertical bar chart. This slide template supports business presentations focused on logistics performance, monthly reports, and operational reviews, making it suitable for corporate presentation decks and pitch deck templates.
What’s on This Slide
The layout features a bar chart on the left side, displaying monthly shipment data from January to August. The chart has vertical bars in a blue color, with the y-axis labeled for shipment counts. To the right, there are four KPI metrics presented in separate boxes, each containing an icon and a numerical value. The icons represent annual shipments, on-time delivery, fleet utilization, and customer satisfaction. Text placeholders are present for a subheading above the chart and a title above the KPI section. The overall composition is balanced, with a clear visual hierarchy.
How to Use It
This layout serves as a performance metrics overview, ideal for presenting key performance indicators in a business context. It fits well after problem framing or service descriptions in a presentation sequence. This structure is useful for logistics companies to showcase operational efficiency, shipment statistics, and customer satisfaction metrics. It can be employed in quarterly reviews or annual reports to highlight performance trends and achievements.
Text Placeholders & Capacity
Keep your copy within these limits so it fits without resizing. Body slots can hold roughly 5-10 words each.
| Placeholder | Count | Max characters (approx.) |
|---|---|---|
| Slide title | 1 | 30 |
| Body paragraph | 1 | 50 |
| Item body | 4 | 10 |
Slide Keywords
Download unlimited PowerPoint templates, charts and graphics for your presentations with our annual plan.
DOWNLOADReturn to Global Shipping PowerPoint Template.