Slide 8 of 8 from Frankfurt am Main PowerPoint Template
Data Driven Chart PowerPoint
Bar Chart Slide for Presentations
- Chart
- Bar Vertical
- Evaluation Slide
- 16:9
- 100% Editable
What’s on This Slide
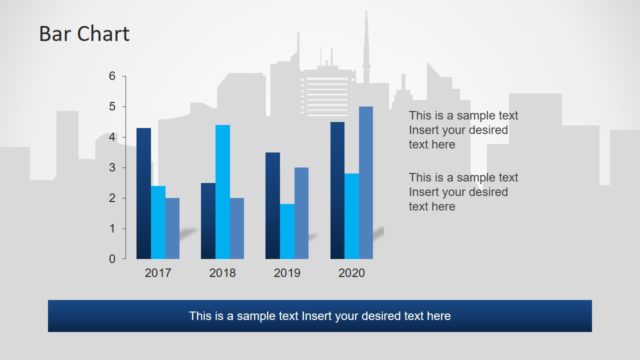
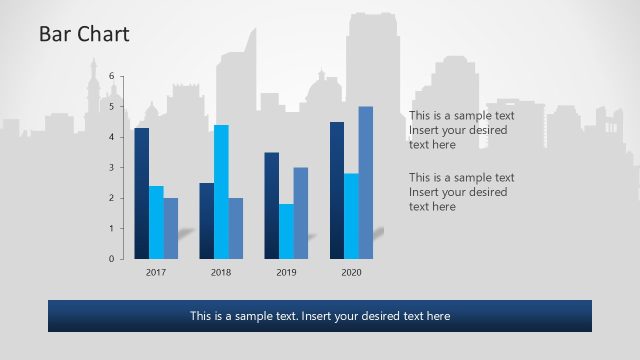
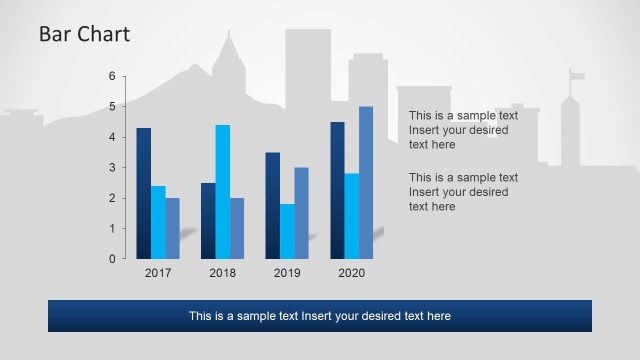
The slide features a vertical bar chart positioned centrally, displaying data for the years 2017 to 2020. Each bar is colored in varying shades of blue, with a gradient effect enhancing the visual appeal. The chart has a vertical axis labeled with numerical values from 0 to 6, and the horizontal axis indicates the years. Above the chart, a title reads 'Bar Chart' in a large font. Below the chart, there are three text placeholders aligned centrally, allowing for additional context or explanations. The background includes a subtle city skyline silhouette.
How to Use It
This layout serves as a data visualization tool, effectively presenting comparative data over a specified time frame. It fits well in a presentation sequence following an analysis or overview slide, allowing for clear communication of trends. This slide is suitable for business reports, performance reviews, or market analysis where numerical data needs to be showcased. It can be used to illustrate growth, sales figures, or other metrics relevant to the audience's interests.
Text Placeholders & Capacity
Keep your copy within these limits so it fits without resizing. Body slots can accommodate roughly 10-12 words each.
| Placeholder | Count | Max characters (approx.) |
|---|---|---|
| Chart title | 1 | 20 |
| Item heading | 4 | 10 |
| Item body | 4 | 30 |
| Body paragraph | 3 | 50 |
Slide Keywords
Download unlimited PowerPoint templates, charts and graphics for your presentations with our annual plan.
DOWNLOADReturn to Frankfurt am Main PowerPoint Template.