Flat Editable Triangle Infographic
Flat Editable Triangle Infographic – Infographics are a simple and modern design practice to represent data in a visual metaphor. The boost of big data and information processing algorithms has powered statistics. Nowadays press and traditional information networks provide relevant and scientific findings that were not available before rather than specific science publications. This kind of information is difficult to present or publish, giving space to advent of infographics to aid this gap between great statisticals results and the ability to publish them to a wide audience.
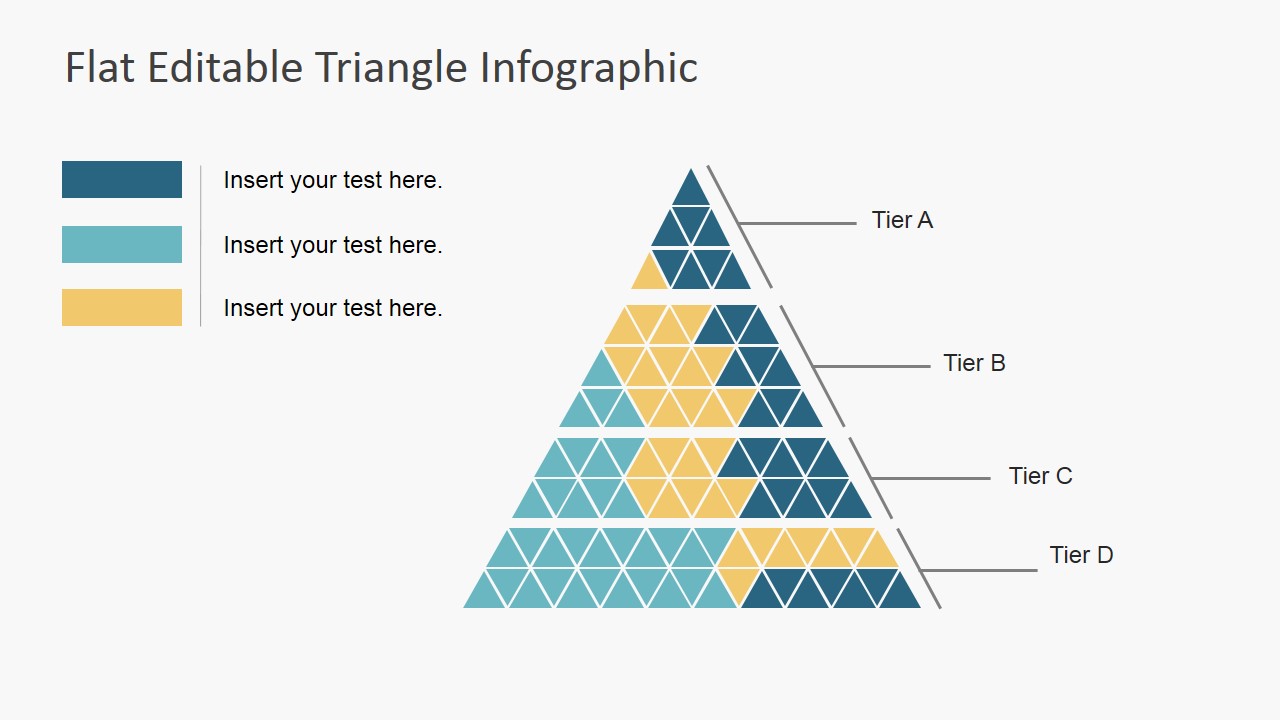
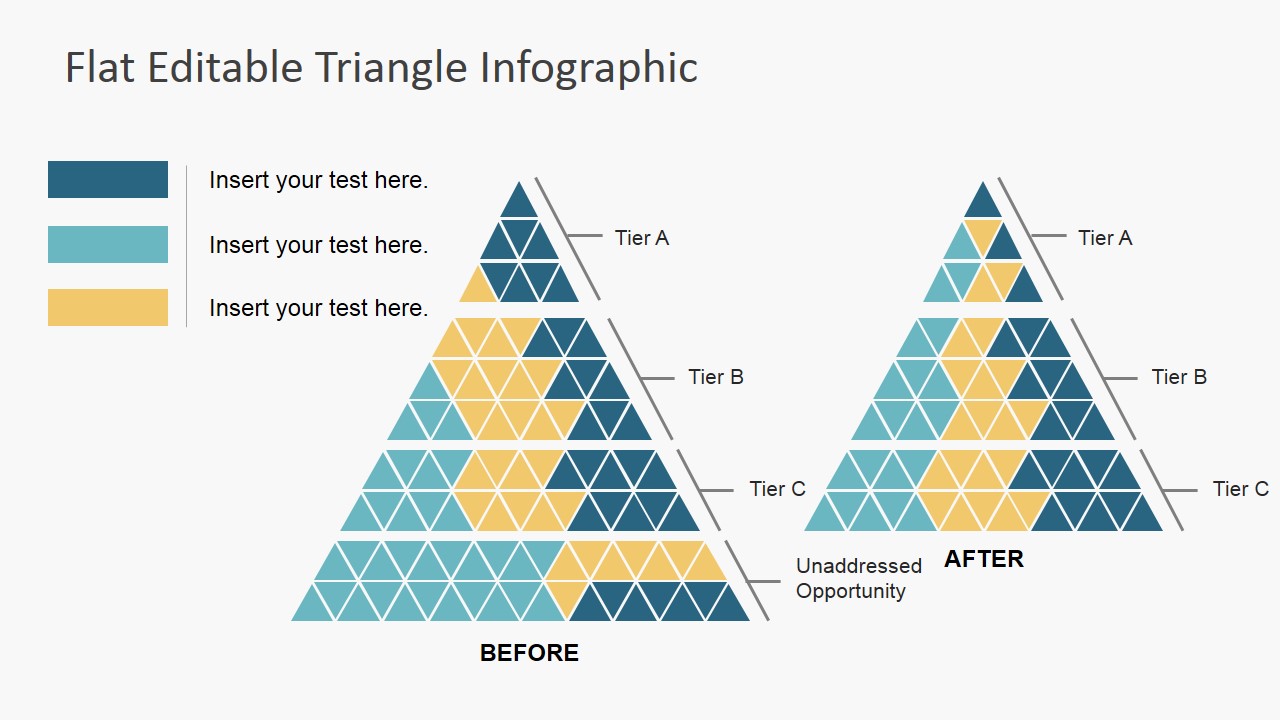
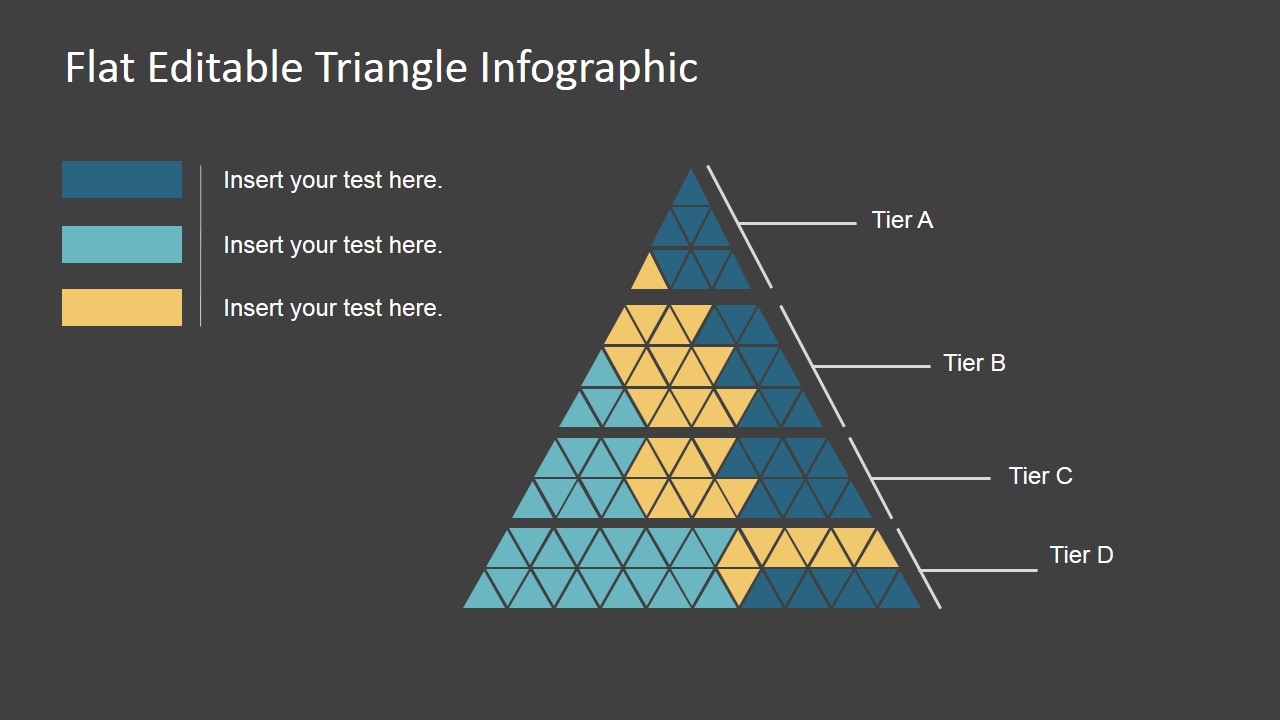
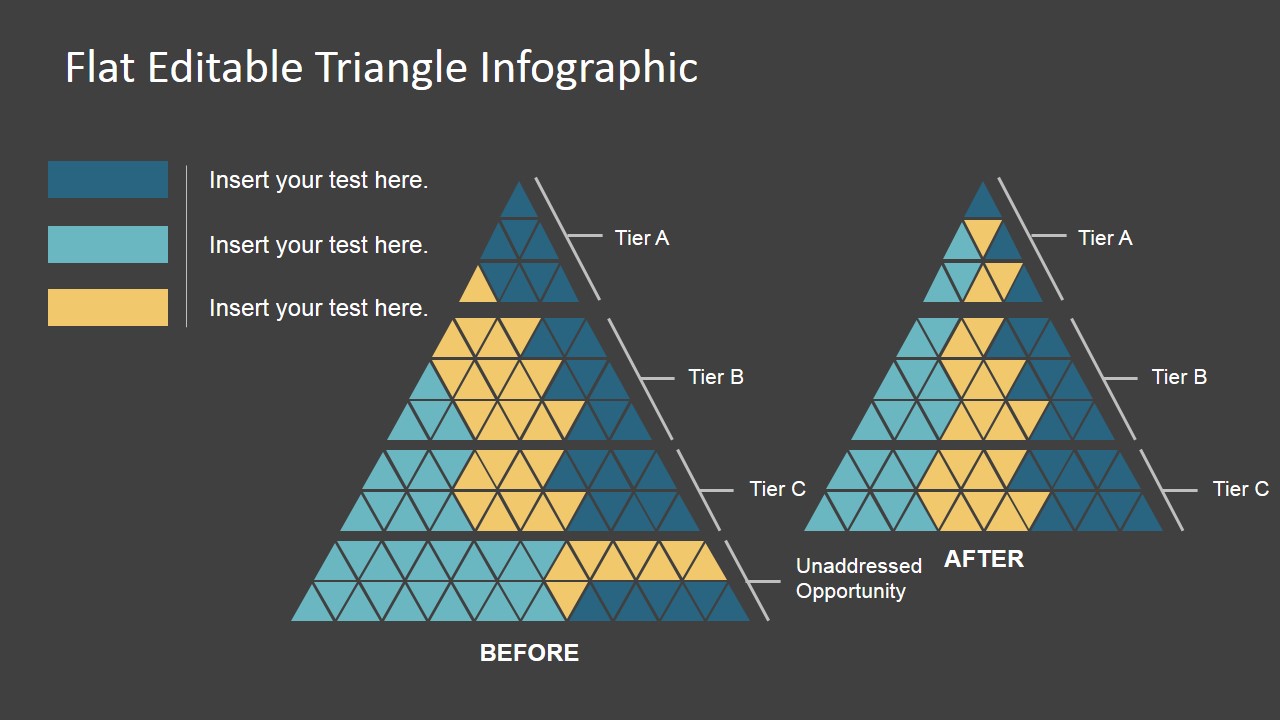
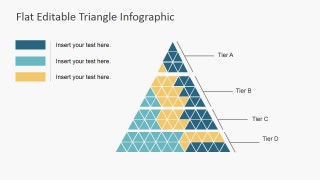
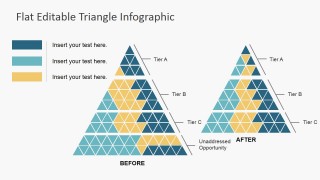
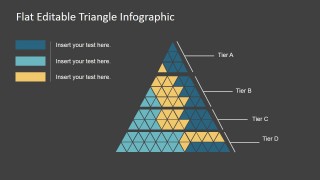
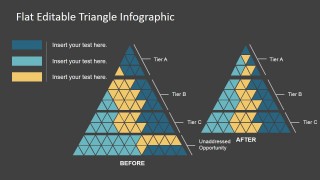
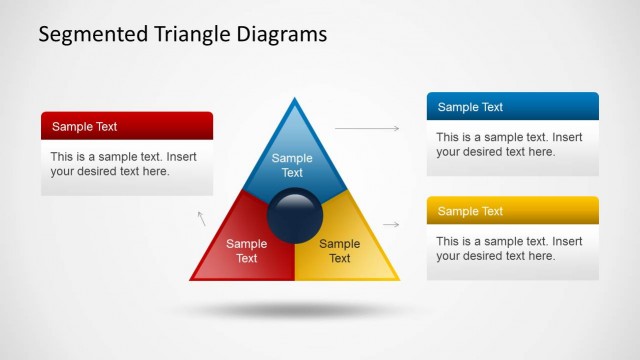
This Flat Editable triangle Infographic is a designed to describe segments of a statistical population, preferably with a discrete sample. The main idea of this graphic is that the main triangle represents the whole set of the sample, and that the different inner triangles, depending on their color, represent series, for sample sub sets. This is a traditional practices in visual representations (for example, pie charts). The triangle version is easy to understand and provides greater granularity when working with large number of series (10 to 15). More than 15 series makes it difficult ot represent, and requires a deeper granularity. Users can check our Infographics Gallery for suitable representations for their presentation.
This PowerPoint Template is 100% editable. Each of the triangles is created as a PowerPoint Shape, allowing the user to fully customize its appearance. Adding new rows of triangles and adapting their appearance is extremely easy; no need of design skills.
