Slide 1 of 2 from Fishbone Diagram PowerPoint Template
Fishbone Diagram PPT Slide Template
Fishbone Diagram PowerPoint Template Overview
- Diagram
- Fishbone
- Problem Framing Slide
- 16:9
- 100% Editable
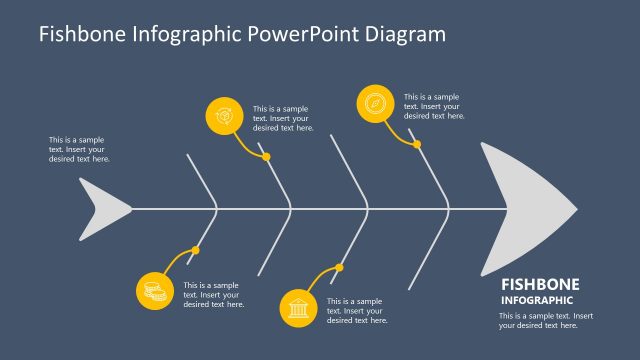
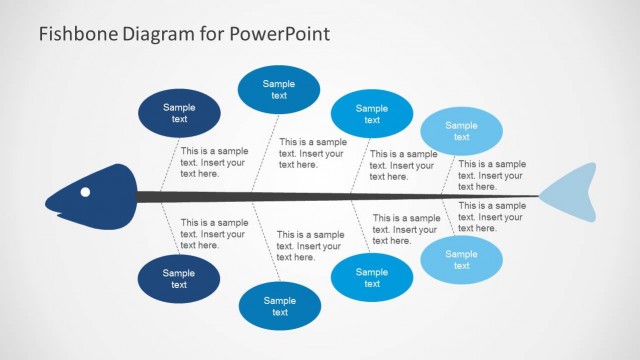
The Fishbone Diagram Layout from the Fishbone Diagram PowerPoint Template provides a structured visual tool for root cause analysis and problem-solving discussions. This slide template features editable shapes and vector icons arranged to facilitate clear brainstorming sessions and business presentations focused on identifying underlying issues. Its design supports effective communication in corporate presentation or slide deck formats, making it a practical choice for teams aiming to analyze complex problems systematically.
What’s on This Slide
The slide features a fishbone diagram with a central fish shape oriented horizontally. Six branches extend from the spine, each containing a circular node labeled with numbers one through six. Each node connects to a placeholder for text, positioned to the right of the nodes. The overall color scheme is a gradient of blue, with a lighter blue for the fish and darker blue for the background. The final element is a red fish shape at the end of the diagram, which also contains a text placeholder. The layout emphasizes a clear visual hierarchy.
How to Use It
This layout serves as a cause-and-effect analysis tool, ideal for identifying root causes of problems. It fits well in presentations discussing problem-solving strategies or process improvements. This diagram can be used in business meetings, workshops, or educational settings where analysis of issues is required. It is particularly useful for brainstorming sessions or team discussions focused on identifying underlying causes of challenges.
Text Placeholders & Capacity
Keep your copy within these limits so it fits without resizing. Node body slots can accommodate roughly 10 words each.
| Placeholder | Count | Max characters (approx.) |
|---|---|---|
| Item heading | 6 | 30 |
| Item body | 6 | 50 |
| Slide title | 1 | 50 |
Slide Keywords
Download unlimited PowerPoint templates, charts and graphics for your presentations with our annual plan.
DOWNLOADReturn to Fishbone Diagram PowerPoint Template.