Financial Summary PowerPoint Template
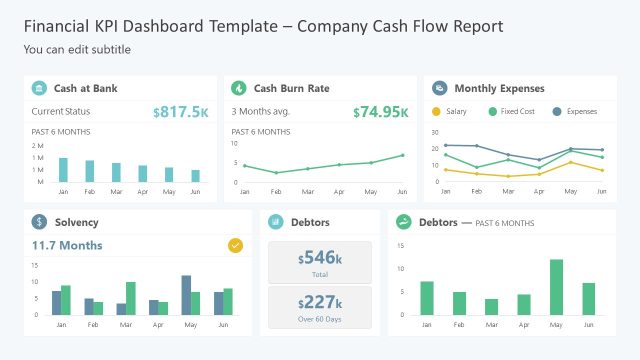
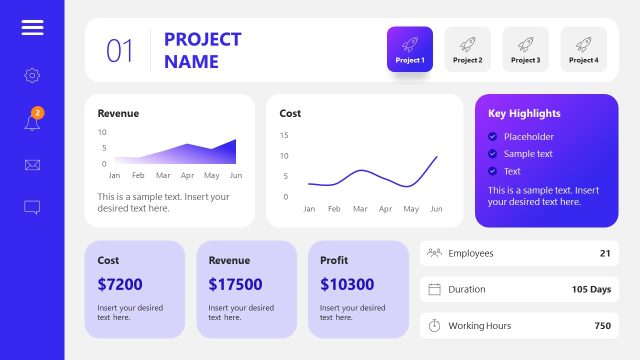
Do you have a lot of statistical data points and want to explain them in a comprehensive style to the executive members? Look no further; try our Financial Summary PowerPoint Template to showcase the cash flows, costs, profits, and losses using engaging data visualizations in a dashboard. Financial information is critical data for the company that helps in understanding its performance and shortcomings. We have created this template for financial experts, business analysts, and data scientists. The data charts in our template help board members and stakeholders identify the trends in the data and discover insights into the company’s performance. The graphical representation of the data enables decision-makers to make better and more informed strategic decisions for the company.
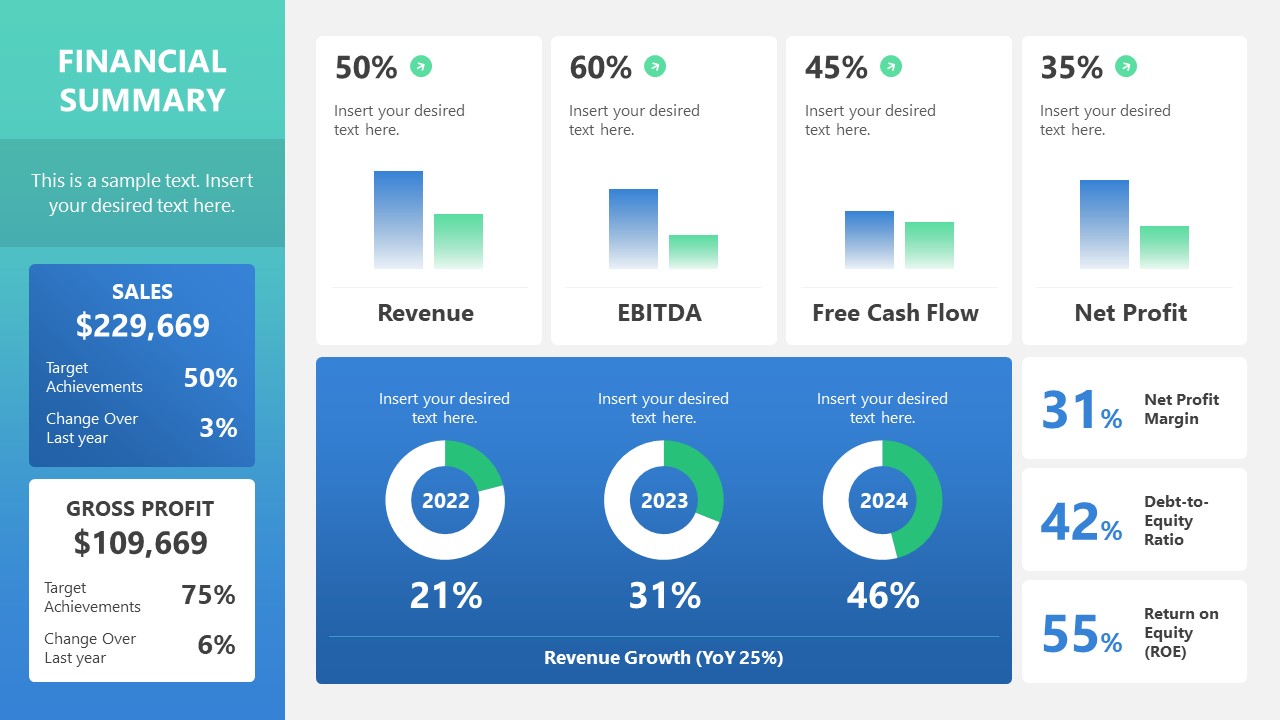
The Financial Summary PowerPoint Template is a single-slide template with a financial data dashboard. The dashboard shows multiple sections in the slide containing distinctive features. At the left, there is a long vertical column displaying the title text, and two boxes are present below it; one is for sales data presentation, and the other comprises information about gross profits. On the right, the top horizontal section has four column charts, which are for:
- Revenue
- EBITDA
- Free Cahsflow
- Net Profit
The lower segment has three pie charts showing different revenue growth aspects. On the lower right part of the slide, statistical percentage numbers illustrate net profit margin, debt-to-equity ratio, and return on equity. Further, this template has 100% editable PPT features; users can change them based on their requirements. They can change the color scheme, types of data visualizations, fonts, and other elements to fit their needs perfectly. Download our financial summary PPT slide layout and edit it for your executive presentations. Try it now! Also, check our article about data presentations.
