Slide 8 of 10 from ElderTech Industry PowerPoint Template
Data Driven Area Chart for Ageing Well
Ageing Well Data Visualization Slide
- Chart
- Line Chart
- Statistics Slide
- 16:9
- 100% Editable
What’s on This Slide
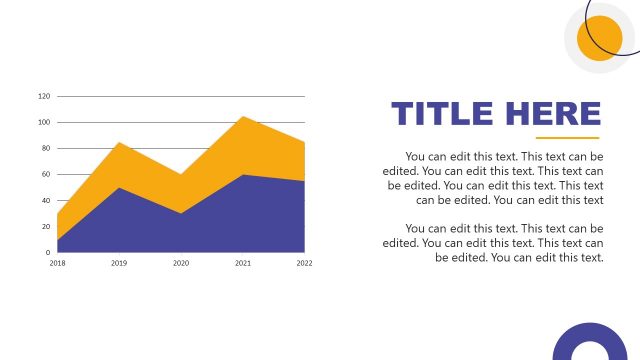
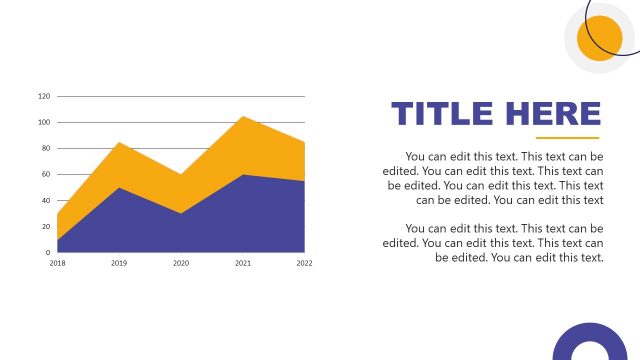
The slide features a line chart positioned on the left side, displaying data trends over the years 2018 to 2022. The chart has two colored areas: a blue area representing one data series and a yellow area for another. Text placeholders are aligned to the right, with a large title at the top, followed by multiple body text sections. The visual hierarchy emphasizes the chart, while the text areas are organized in a vertical format. The background is predominantly white, enhancing readability.
How to Use It
This layout serves as a data visualization slide, ideal for presenting trends or comparisons over time. It fits well in a presentation sequence after problem identification and before strategic recommendations. This structure is useful for business contexts, such as showcasing market growth, demographic changes, or technology adoption rates among the elderly. It allows for clear communication of statistical insights.
Text Placeholders & Capacity
Keep your copy within these limits so it fits without resizing. Body slots can accommodate roughly 15-20 words each.
| Placeholder | Count | Max characters (approx.) |
|---|---|---|
| Slide title | 1 | 30 |
| Body paragraph | 5 | 100 |
Slide Keywords
Download unlimited PowerPoint templates, charts and graphics for your presentations with our annual plan.
DOWNLOADReturn to ElderTech Industry PowerPoint Template.