Slide 11 of 14 from Digital Out of Home Advertising PowerPoint Template
Area Plot Slide – Digital Out of Home Advertising Template
Line Chart Slide for Digital Advertising Presentation
- Chart
- Line Chart
- Evaluation Slide
- 16:9
- 100% Editable
What’s on This Slide
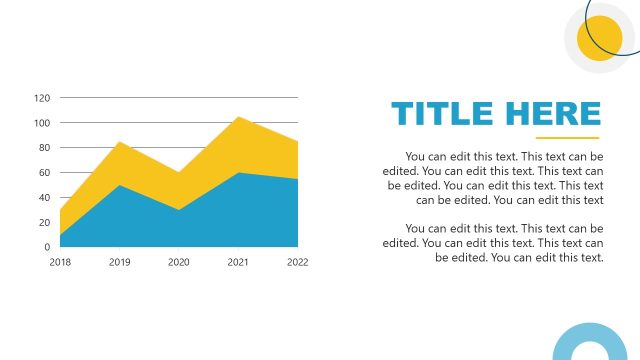
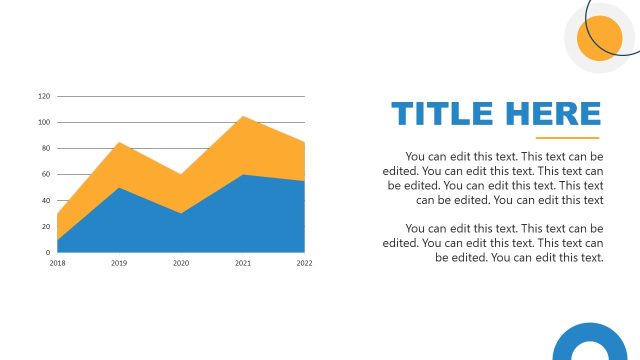
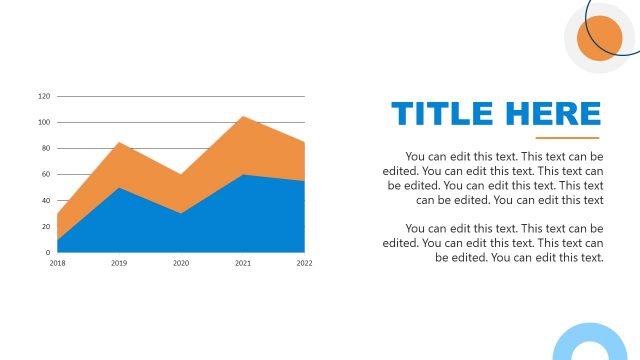
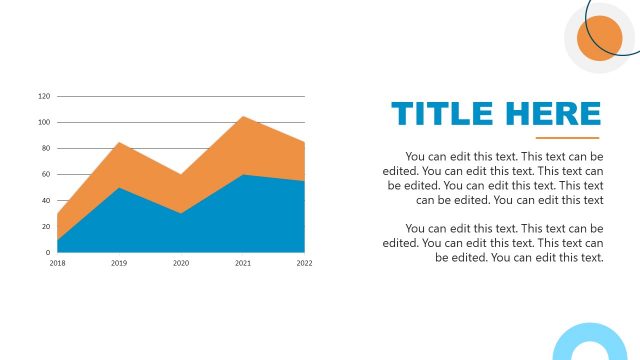
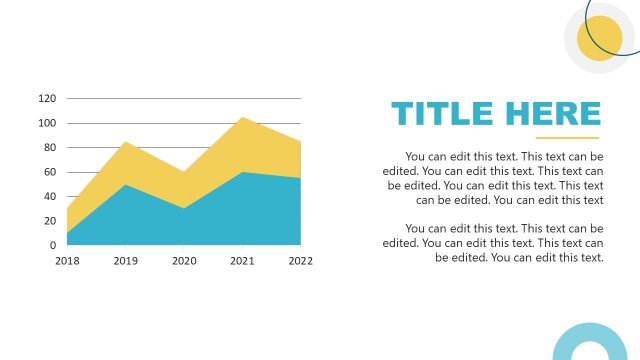
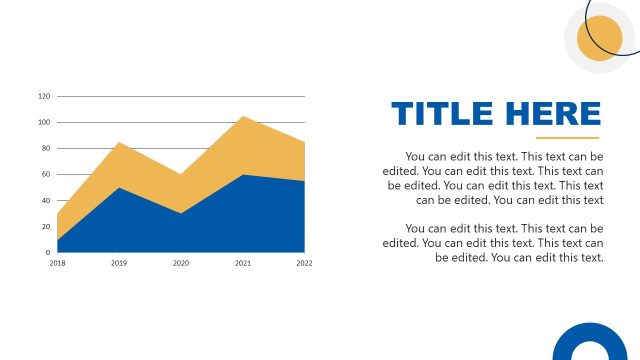
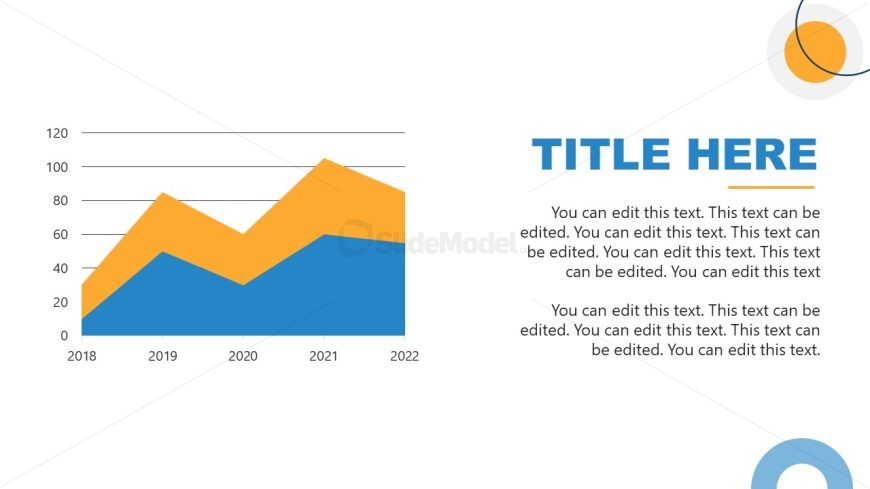
The slide features a line chart positioned on the left side, displaying two data series in blue and orange. The x-axis represents years from 2018 to 2022, while the y-axis shows values from 0 to 120. Text placeholders are aligned on the right side, with a large title placeholder at the top and smaller body text placeholders below it. The chart is visually prominent, with a clear hierarchy that emphasizes the data. Background elements include circular shapes in the top right corner, contributing to the overall layout.
How to Use It
This layout serves as a data visualization tool, ideal for presenting trends over time. It fits well in a marketing presentation, particularly when discussing performance metrics or growth statistics. The structure allows for a clear comparison of multiple data points, making it suitable for business reviews or strategy discussions. This slide can be used to illustrate key performance indicators or market analysis results effectively.
Text Placeholders & Capacity
Keep your copy within these limits so it fits without resizing. Body slots can accommodate roughly 15-20 words each.
| Placeholder | Count | Max characters (approx.) |
|---|---|---|
| Slide title | 1 | 30 |
| Body paragraph | 5 | 100 |
Slide Keywords
Download unlimited PowerPoint templates, charts and graphics for your presentations with our annual plan.
DOWNLOADReturn to Digital Out of Home Advertising PowerPoint Template.