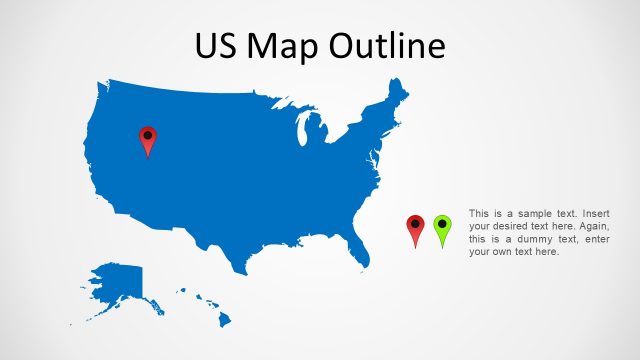
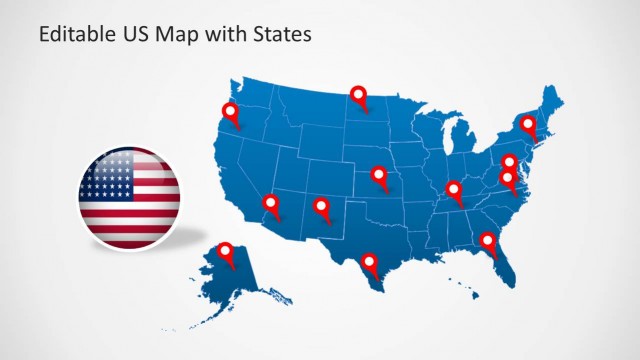
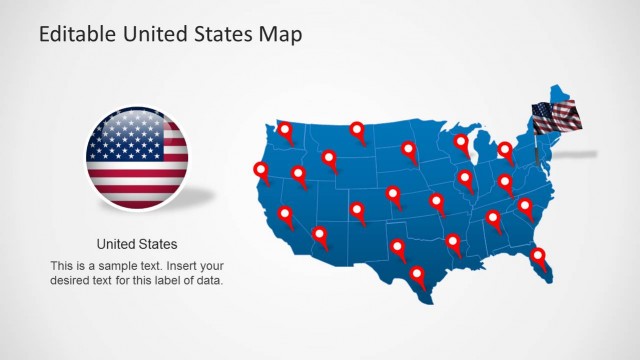
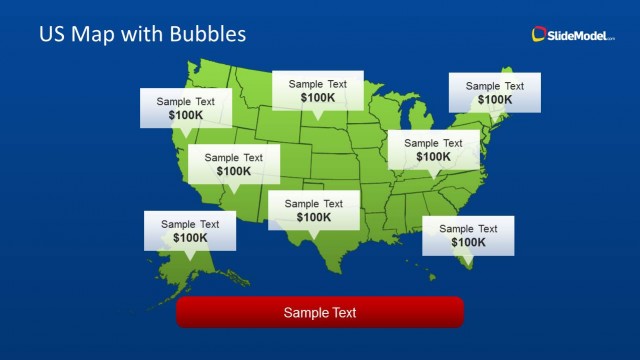
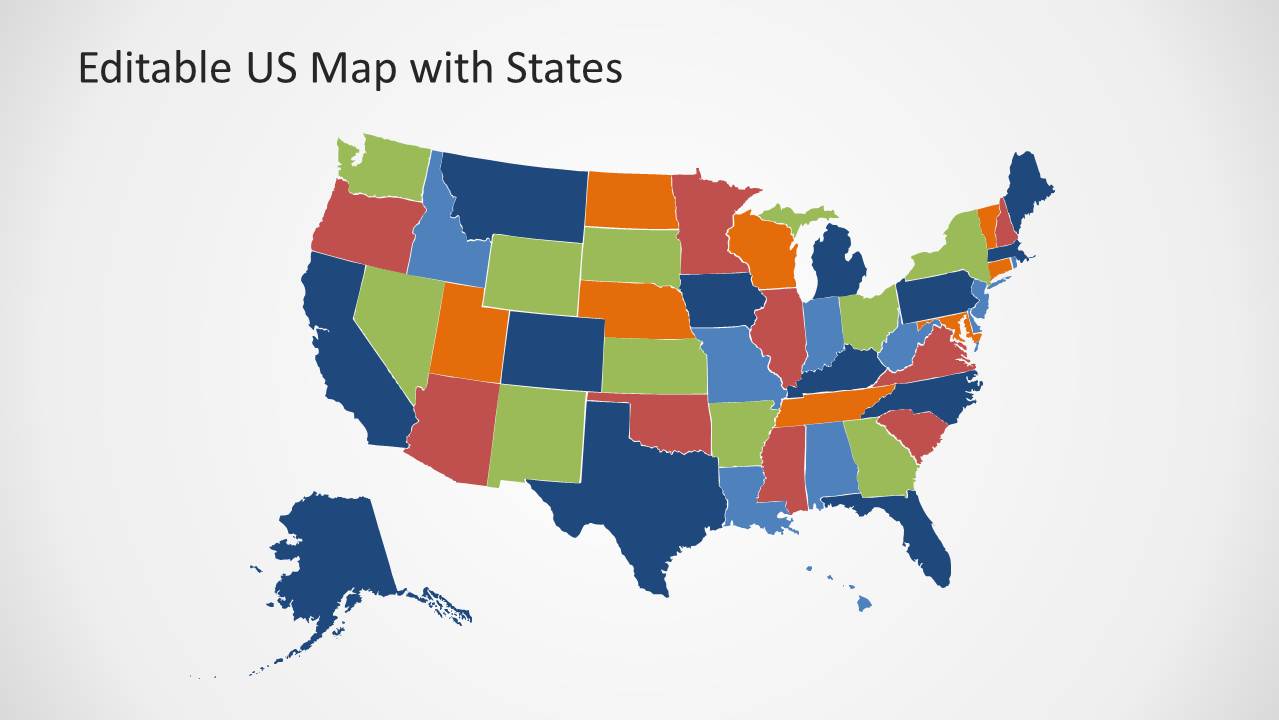
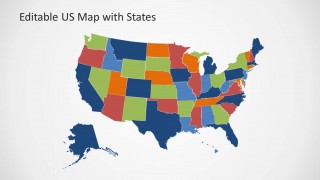
Editable US Map Template for PowerPoint with States is a presentation design containing an editable US Map with States. You can easily customize the slides with any desired State to represent demographics information in a PowerPoint slide or you can prepare presentations showing the sales by state and highlight the states with any desired color or special effect.
What’s inside this template
Example presentation scenarios
- A sales director can present territory coverage by coloring states in the full US map and using the legend slides to explain account ownership or market tiers.
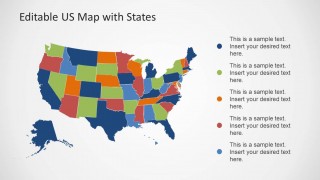
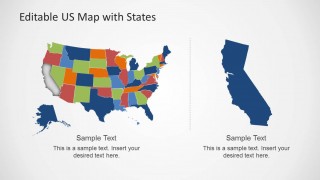
- A marketing analyst can summarize demographic segments by state with the color-coded map and right-side legend, keeping category definitions visible beside the geography.
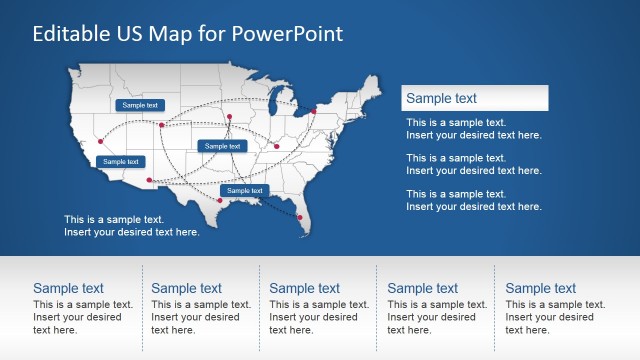
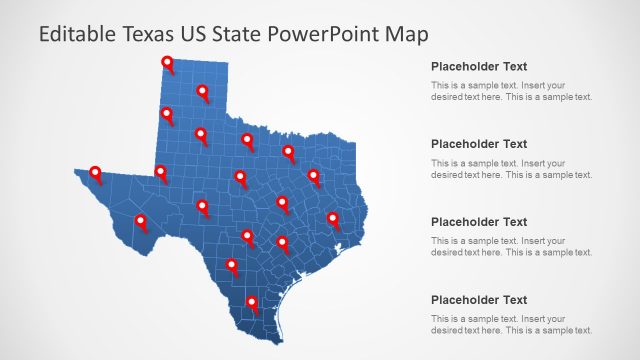
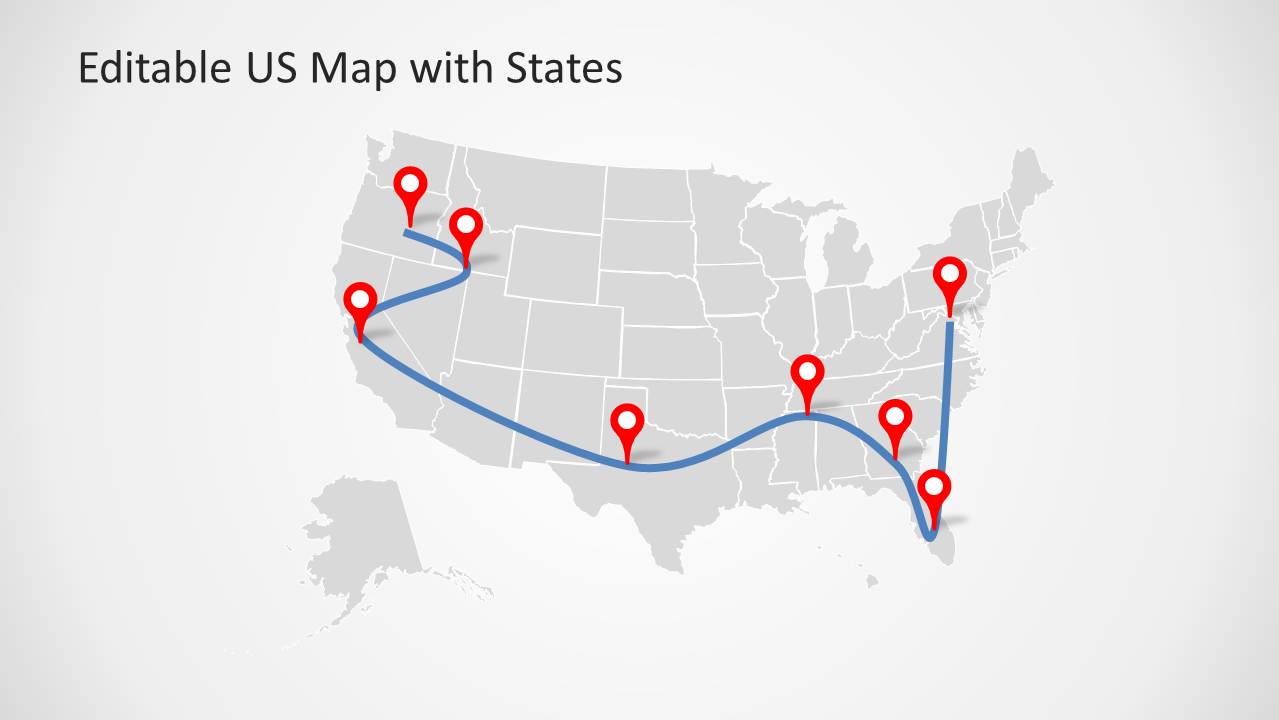
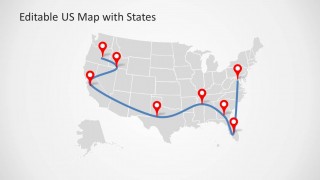
- An operations manager can explain a distribution route or site visit plan with the gray US map, red location pins, and blue connecting path.
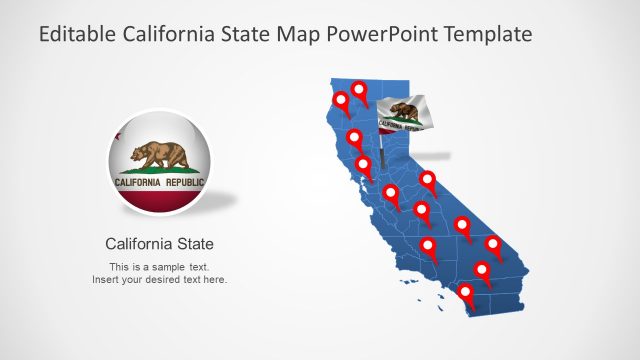
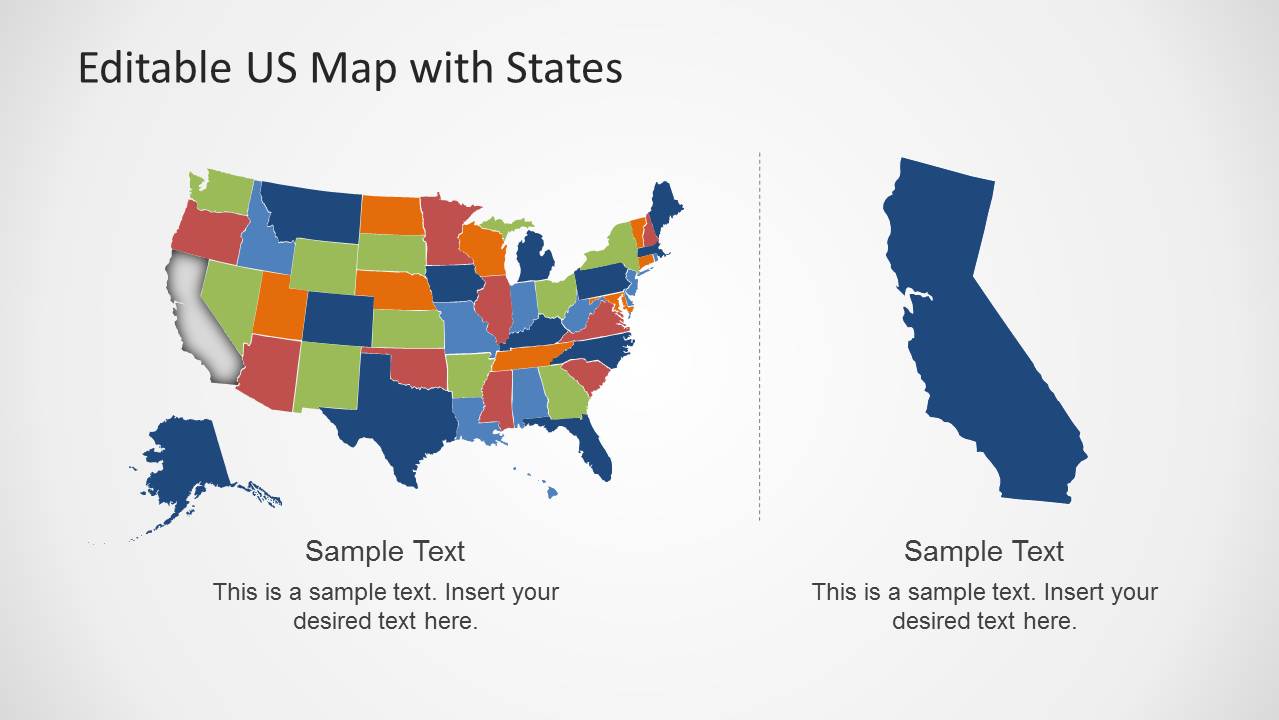
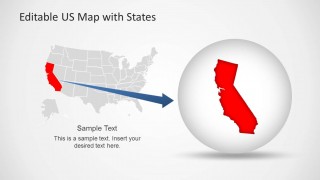
- A regional manager can focus attention on California by using the state zoom layouts to move from national context to one highlighted market.
Features
- 100% editable presentation template
- Compatible with Microsoft PowerPoint and Google Slides
- Scalable vector shapes, icons and illustrations
- AI-Ready for Microsoft Copilot and Claude
- Instant access and download
Frequently asked questions
Q: How should I present a regional message without overloading the map?
A: Start with the clean national map to establish scope, then move to a legend slide only when the color categories need explanation. Keep each color tied to one clear meaning, such as territory, priority, or segment. Use callouts for only the few states that need commentary, so the map remains readable.
Q: Who is this template best suited for?
A: This template fits presenters who need to explain US geography at the state level, such as sales leaders, demographic analysts, operations planners, and public sector teams. It works best when the audience must compare regions, understand coverage, or follow a route. The California zoom slides are useful when a national story narrows to one state.
Q: Why combine full US maps, legends, pins, and a zoom view?
A: The sequence gives the audience different levels of geographic attention. Full maps show national context, legends translate color into meaning, pins show specific locations, and the zoom metaphor signals a shift from overview to detail. This keeps the presenter from forcing every message onto a single crowded map.



Editable US Map Template for PowerPoint with States
7-slide US map presentation template with state territories, route pins, and regional legends
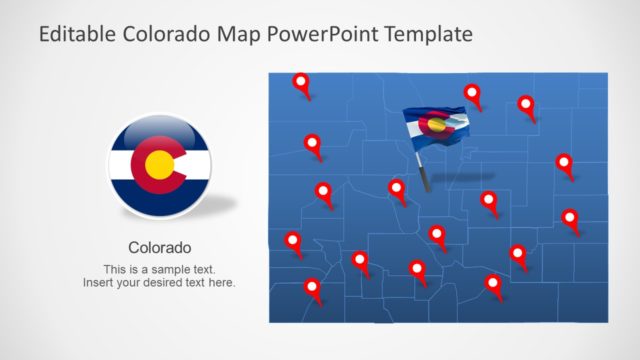
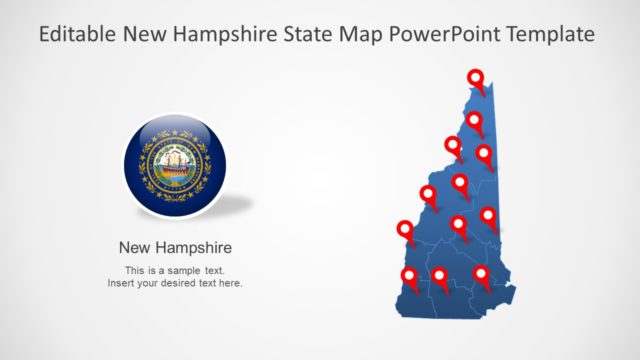
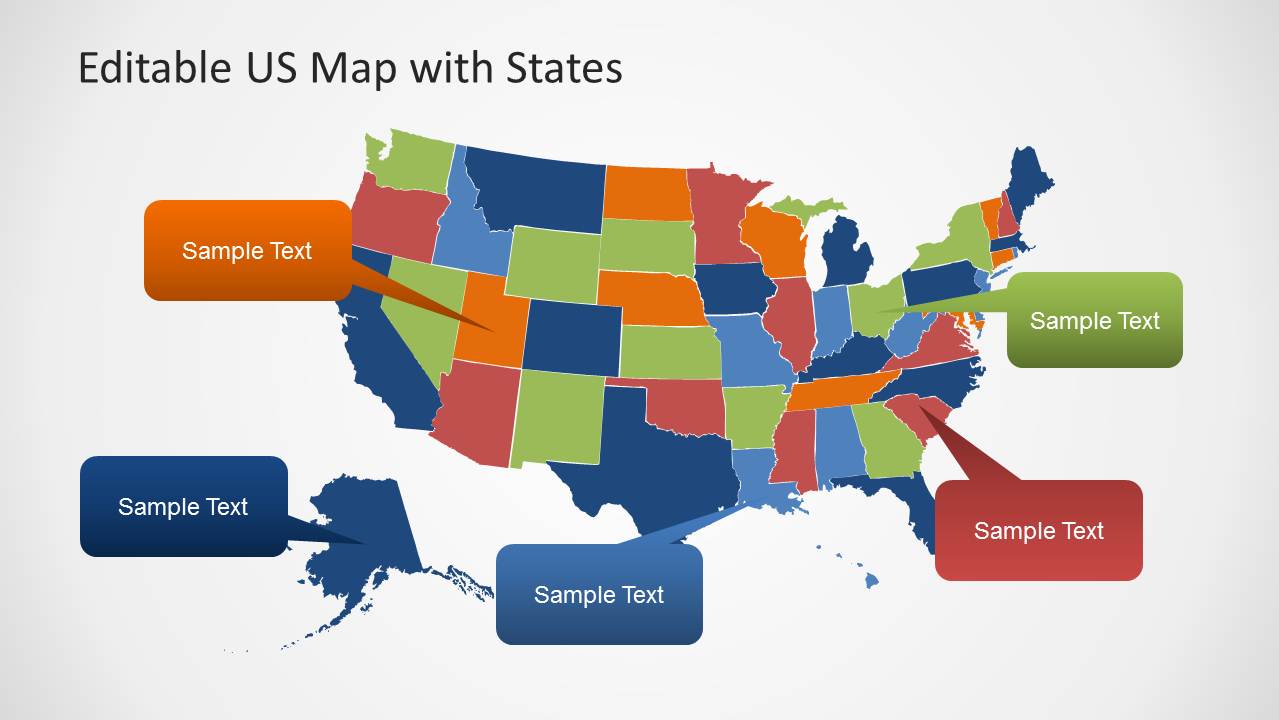
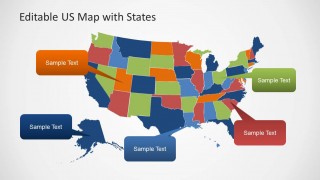
Editable US Map Template for PowerPoint with States is a 7-slide map template for showing US state territories, regional color coding, location paths, and highlighted state detail. Visible layouts include a multicolor state map with callouts, legend maps, a route map with pins, and a California zoom. It is for sales, demographics, operations, and territory reporting in PowerPoint.


 Loading...
 Microsoft PowerPoint
  Microsoft Copilot
  Claude for PowerPoint
 Other formats supported
Subscribe today and get immediate
access to download our PowerPoint templates.