Down & Up Slide Template for PowerPoint
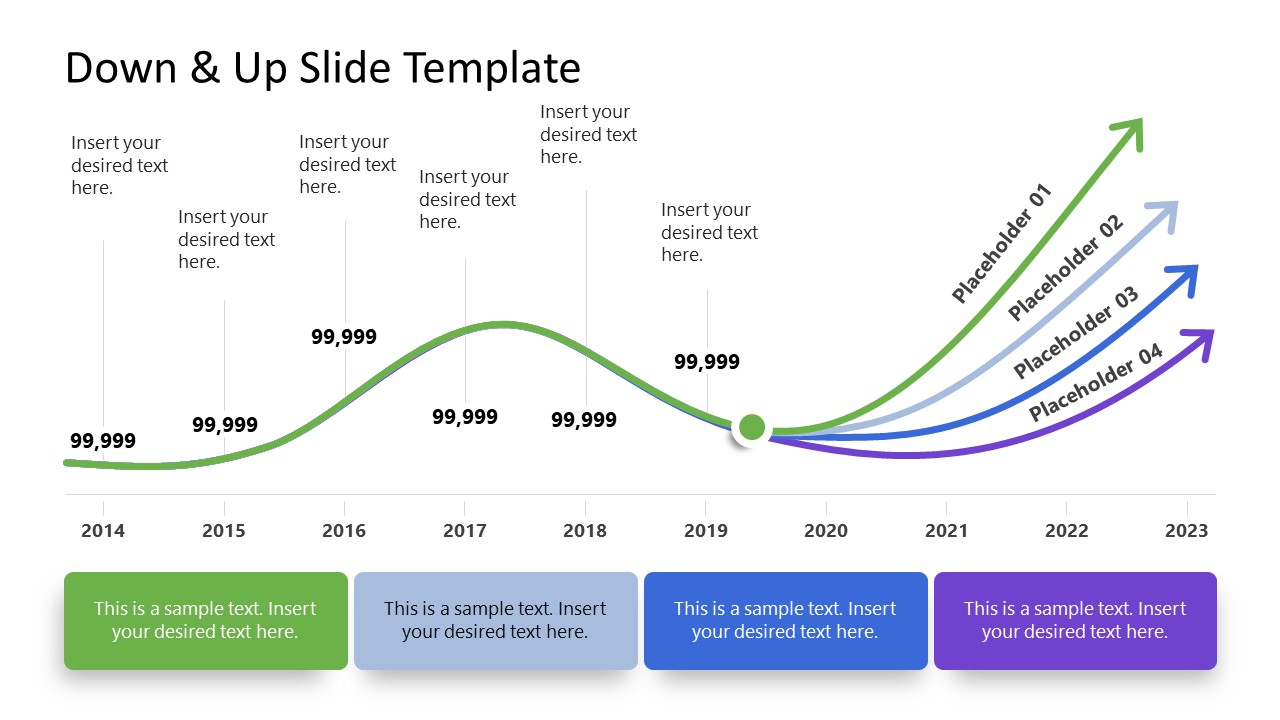
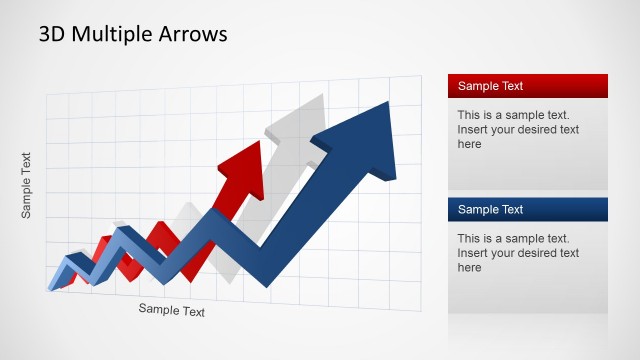
The Down & Up Slide Template for PowerPoint is a data presentation template featuring the alternate rise & fall of the arrow. This concept diagram is created to showcase the stats of a fluctuating trend that ultimately becomes stable and beneficial. For instance, a company’s revenue generation takes years to reach a point when it takes off to the highest expectations. Our down & up slide template provides a time scale and equally distant markings to indicate financial or other statistical growth trends with time. Users can edit the timeline and mention their data along the diagram.
Presenters are given two design variant slides in this Down & Up Slide Template for PowerPoint. The first slide shows an arrow diagram with three phases, i.e., first up, then down, and then up. This growing arrow is divided into four rising arrows in the last phase (growth phase). Presenters can indicate these arrows as revenue-generating departments or products etc., of the company in financial presentations. At different points of this arrow, vertical thin lines carry editable text to add associated values. Users can change the yearly timeline to monthly, weekly, or any other based on their requirements. The slide further contains four color text boxes to incorporate details.
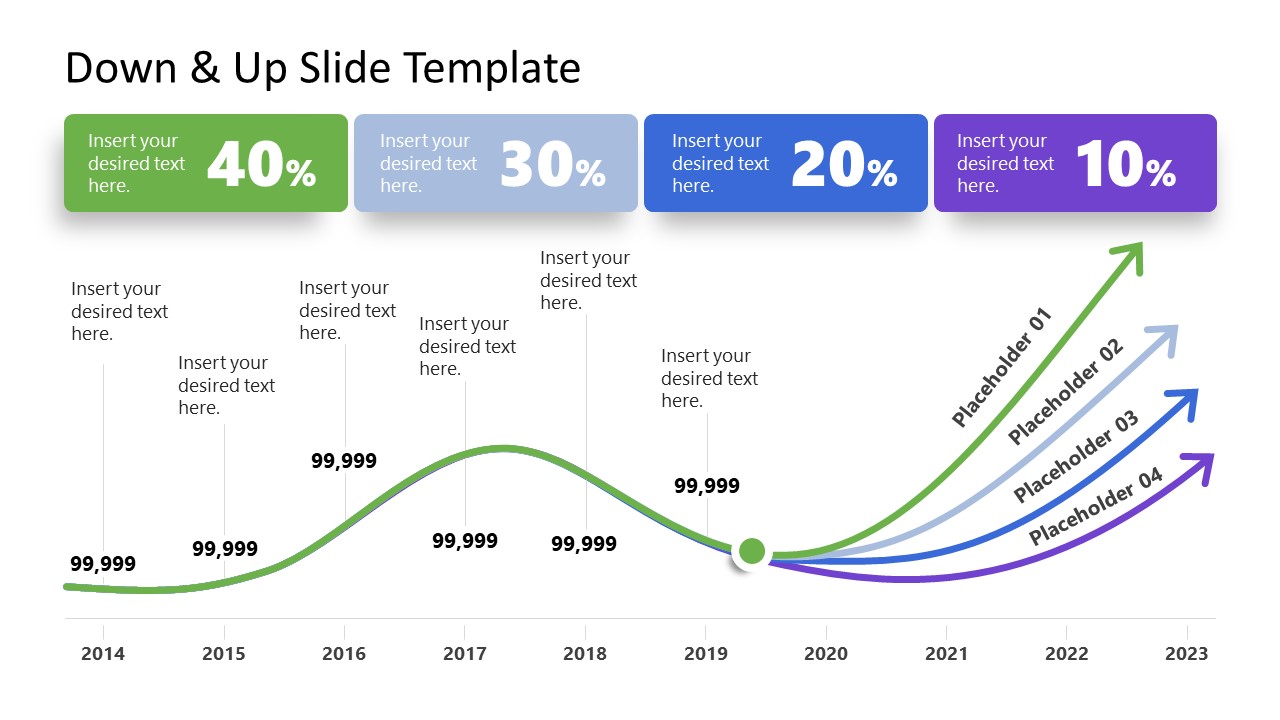
The next slide of this down & up slide template is similar to the first one but differs concerning the position of colored text boxes. It carries these shapes on the top of the arrow diagram with percentage placeholder text. Users can mention their percentage growth or decline values along the curves of the arrow line. Presenters can also apply this template for other purposes. For instance, it can help present the performance of the employees, user interaction with the company, and similar concepts. So, grab this unique presentation template for your business presentations and edit it with PowerPoint or Google Slides.
