Slide 1 of 2 from Down & Up Slide Template for PowerPoint
Down & Up Slide with Arrow Diagram for PPT
Down & Up Trend Analysis Slide
- Diagram
- Timeline Horizontal
- Process Slide
- 16:9
- 100% Editable
What’s on This Slide
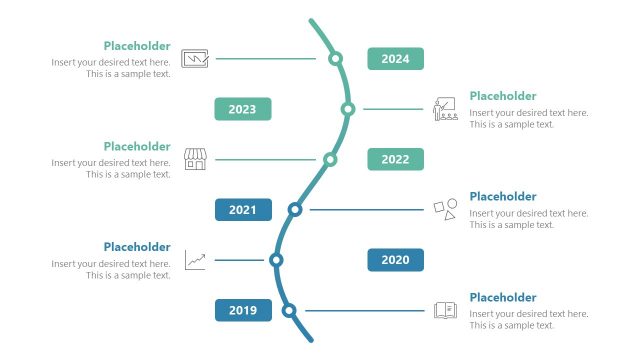
The slide features a curved line graph with a green upward trend and a downward dip. Four arrows extend from the curve, each labeled with placeholders, indicating different data points. The timeline runs horizontally from 2014 to 2023, with vertical markers for each year. Below the graph, there are four rectangular text placeholders aligned in a row, each with a different background color: blue, light blue, light green, and dark green. The title is positioned at the top center, with additional text placeholders below it. The overall layout is structured and clear.
How to Use It
This layout serves as a trend analysis tool, effectively illustrating upward and downward movements over time. It fits well in presentations discussing business performance, revenue growth, or market analysis. This slide can be used to present financial forecasts, sales trends, or project timelines. It is particularly useful for stakeholders needing to visualize progress or changes in data over a specified period, making it ideal for quarterly reviews or strategic planning sessions.
Text Placeholders & Capacity
Keep your copy within these limits so it fits without resizing. Body slots can hold about 10-15 words each.
| Placeholder | Count | Max characters (approx.) |
|---|---|---|
| Slide title | 1 | 30 |
| Item heading | 4 | 20 |
| Body paragraph | 4 | 50 |
Slide Keywords
Download unlimited PowerPoint templates, charts and graphics for your presentations with our annual plan.
DOWNLOADReturn to Down & Up Slide Template for PowerPoint.