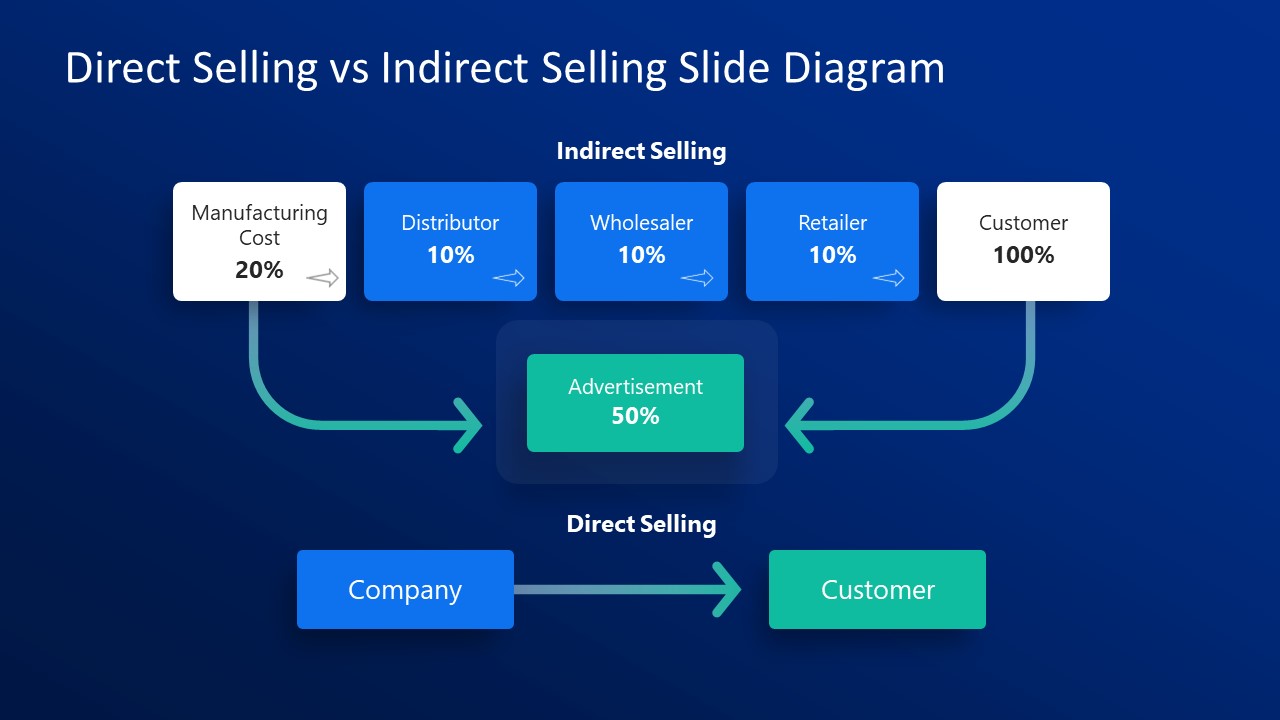
Our Direct Selling vs. Indirect Selling PowerPoint Template features an editable flow diagram to demonstrate the selling strategy of the business. Businesses have differences in their sales processes, which varies depending upon the intermediaries of the sales channel. The direct and indirect selling strategies are two techniques followed by small businesses, dropshipping sites, and even large-scale e-commerce parties. In the direct selling strategy, there is a direct relationship between the seller (company) and the consumer, like B2C. Whereas the indirect selling process has several components through which the product passes to reach the end-user.
This direct selling vs. indirect selling diagram for PowerPoint shows these two sales processes through two horizontal flow diagrams indicating the product flow through the sales stream and how different cost percentages are added at each level the consumer pays. The diagram in the upper section of the slide shows five square text boxes connected via thin arrowheads. The first square segment represents the manufacturing cost (20%), then the following segments denote the distributor(10%), wholesaler(10%), and retailer(10%) costs, respectively. It is also indicated through this diagram that the purchasing party also pays the marketing cost of the advertisements invested to reach the customers. The last square of the flow chart shows the customer who pays the 100% cost of the product. A separate rectangular box is shown connected from two ends of the diagram that illustrates a link between the company and consumer through curved arrows.
The second diagram is a simple two-step process illustration showing a direct link between the company and consumers. Users can edit these sections to present the cost contribution at each level of the sales process. Presenters can also modify the involved bodies. For instance, professionals can conveniently delete the square segment if the sales process doesn’t include the distributor category. Similarly, additional square shapes can be added to the diagram. So, this Direct Selling vs. Indirect Selling PowerPoint Template can be used for business meetings and training sessions to discuss the sales processes. Users can choose between the two background color variants of direct selling vs. indirect selling slides for their presentations.
What’s inside this template
Example presentation scenarios
- A sales manager can use the indirect selling chain to explain how distributor, wholesaler, retailer, advertising, and customer costs affect the final price.
- A small business owner can compare the direct company-to-customer path with the multi-step channel before choosing a go-to-market model.
- A retail trainer can use the percentage cost boxes and arrows to teach new team members how channel intermediaries change pricing and margins.
- An e-commerce consultant can replace the participant labels to map a client's current channel and show where a direct selling model may reduce friction.
Features
- 100% editable presentation template
- Compatible with Microsoft PowerPoint
- 16:9 aspect ratio slides
- Scalable vector shapes, icons and illustrations
- AI-Ready for Microsoft Copilot and Claude
- Instant access and download
Frequently asked questions
Q: How should a presenter explain the comparison without overloading the audience?
A: Start with the indirect selling row because it contains more steps, then move to the simpler direct selling row. Call out one cost or decision point at a time: manufacturing, intermediaries, advertisement, and customer payment. This keeps the audience focused on the sales channel logic rather than reading every label at once.
Q: Who is this template best suited for in a business presentation?
A: It fits presenters who need to make a channel strategy decision visible, such as sales managers, small business owners, retail consultants, or trainers. The diagram is strongest when the goal is to compare how intermediaries affect pricing, control, and customer connection instead of presenting detailed financial performance.
Q: Why does the side-by-side flow design help explain sales strategy?
A: The top flow uses a longer path to show indirect selling complexity, while the bottom flow uses a short company-to-customer path to show direct selling simplicity. The arrow metaphor makes product movement and cost accumulation easy to follow, and the central advertisement block highlights a shared influence on customer demand.



Direct Selling vs Indirect Selling PowerPoint Template
2-slide presentation template comparing direct and indirect selling with sales channel flow diagrams
The Direct Selling vs Indirect Selling PowerPoint Template is a 2-slide business diagram for Microsoft PowerPoint. It compares an indirect selling chain, a direct company-to-customer process, percentage cost boxes, and an advertisement cost block. Sales teams, trainers, and small business presenters can explain channel structure and cost buildup.
- Category
- Business PowerPoint Templates
- Rating

 Loading...
- Aspect ratio
- 16:9
- Item ID
- 21600-01
- Colors
 Microsoft PowerPoint
 Microsoft Copilot
 Claude for PowerPoint
Other formats supported
Subscribe today and get immediate
access to download our PowerPoint templates.