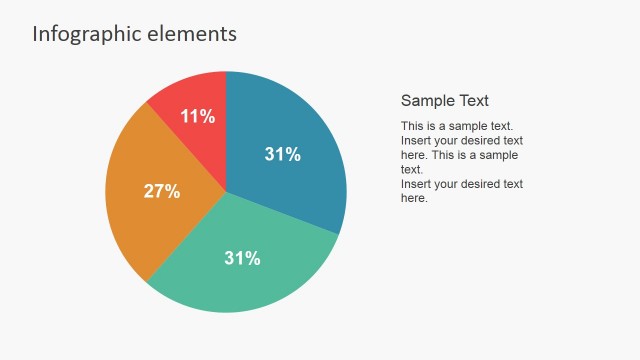
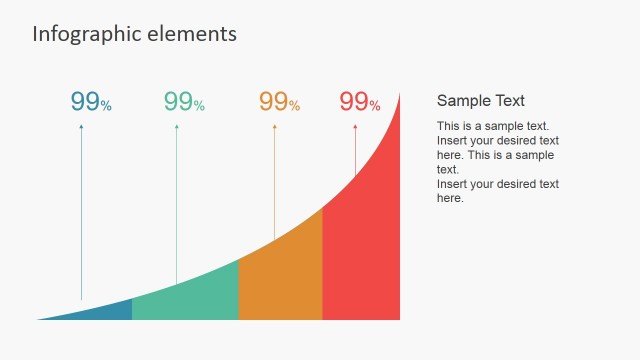
Flat Area Chart for Infographic Presentations
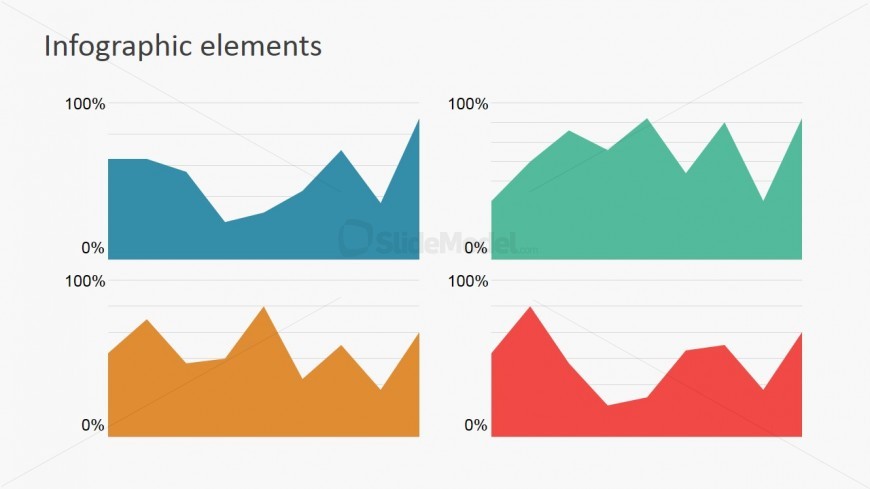
The slide design features flat area charts for infographic presentations, which may be used to show cumulative statistical data that are relevant to the business organization. The PowerPoint slide can be utilized so as to show four sets of data simultaneously, for comparison and extensive analysis by key members of the company.
The PowerPoint template contains four area chart PowerPoint graphics arranged in a two-by-two grid. The charts are colored in pastel colors, such as blue, green, orange, and red, which create a visually-appealing presentation. All PowerPoint objects are 100% editable to suit the presenter’s needs and preferences.