Slide 1 of 2 from Dashboard PowerPoint Template
Dark Dashboard US Map for PowerPoint
KPI Dashboard PowerPoint Slide
- Chart
- Gauge Meter
- Kpi Reporting Slide
- 16:9
- 100% Editable
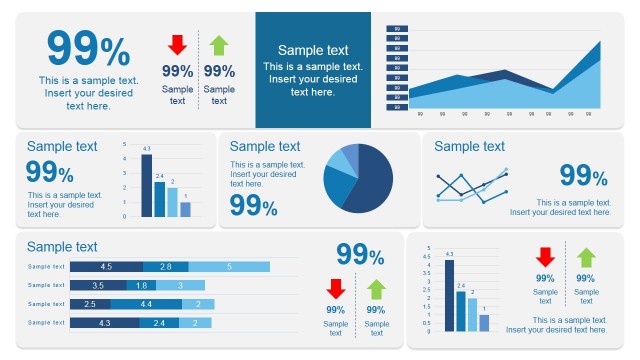
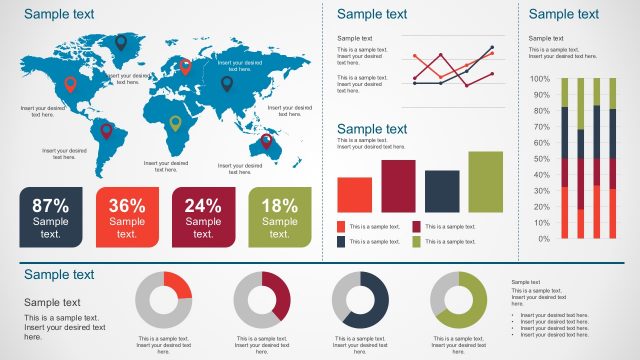
The KPI Dashboard with Map and Indicators slide from the Dashboard PowerPoint Template offers a clear layout for tracking performance metrics across regions. Featuring editable shapes and vector icons, it supports effective KPI reporting and sales presentations within a corporate presentation or business presentation slide deck.
About This Slide
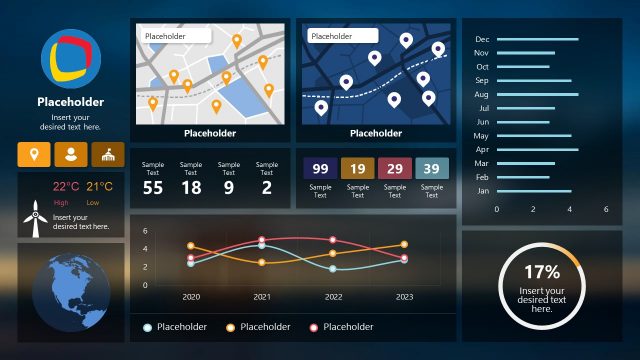
Dark Dashboard design for PowerPoint presentations containing different dashboard components to be used in a cockpit PowerPoint presentation design including US Map for PowerPoint with map markers, charts, gauge bars, time and date as well as other useful components and PowerPoint icons.
What’s on This Slide
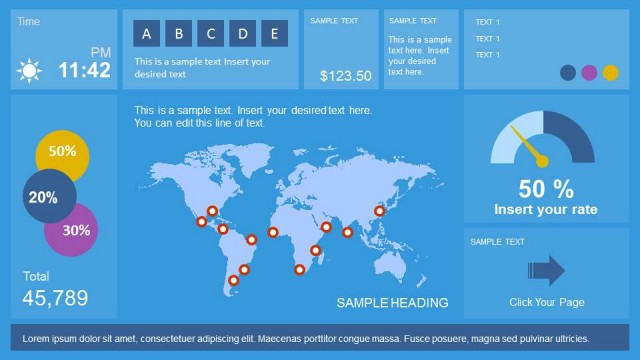
The layout features a dark background with a US map positioned centrally. Various KPI indicators are displayed in circular shapes on the left, showing percentages in red, yellow, and green. A gauge chart is located on the right, indicating a rate of 24.5%. Text placeholders are present at the top for time and sample headings, with additional placeholders for metrics and totals below. The overall composition is structured with a clear visual hierarchy, separating the map, indicators, and textual information effectively.
How to Use It
This layout serves as a KPI dashboard, ideal for presenting performance metrics and geographical data in a business context. It fits well in presentations focused on performance tracking or reporting. This slide can be used in meetings to showcase key performance indicators, sales data, or operational metrics. It is particularly useful for stakeholders needing a quick overview of performance across different regions.
Text Placeholders & Capacity
Keep your copy within these limits so it fits without resizing. Body slots are tight, roughly 8 words each.
| Placeholder | Count | Max characters (approx.) |
|---|---|---|
| Slide title | 1 | 30 |
| Body paragraph | 5 | 50 |
| Item heading | 3 | 10 |
| Item body | 3 | 10 |
| Kpi value | 1 | 10 |
Slide Keywords
Download unlimited PowerPoint templates, charts and graphics for your presentations with our annual plan.
DOWNLOADReturn to Dashboard PowerPoint Template.