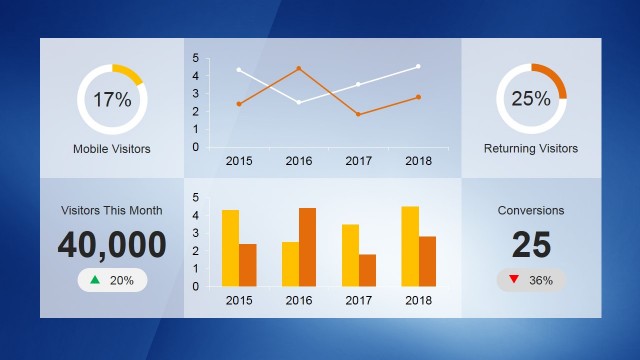
Slide 3 of 3 from Free Sales Management Dashboard PowerPoint Template
Dashboard for Management and Sales PPT
Sales Performance Dashboard Overview
- Chart
- Dashboard Composite
- Kpi Reporting Slide
- 16:9
- 100% Editable
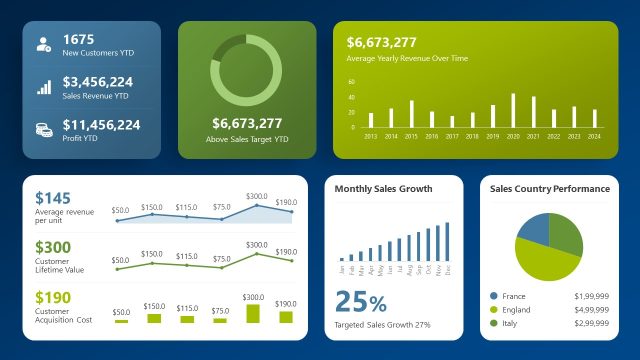
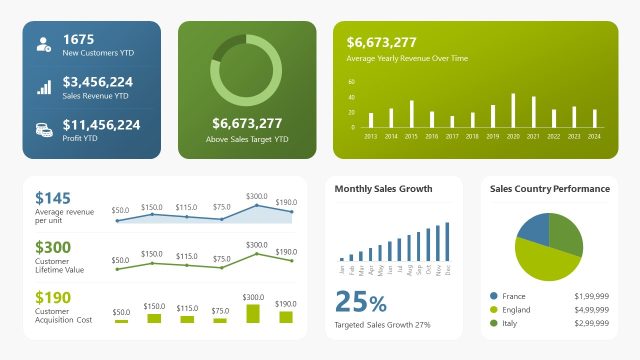
The Sales Performance Dashboard slide from the Free Sales Management Dashboard PowerPoint Template offers a comprehensive layout for visualizing key sales metrics. Designed for quarterly reviews and team assessments, this slide integrates editable shapes and vector icons to present data clearly. It supports business presentations that require concise KPI reporting and financial summaries within a professional slide deck.
What’s on This Slide
The layout features a grid of nine distinct elements, including icons and data points. The top row contains three blocks: a line graph icon, a coin stack icon, and a numeric value. The middle row has a line chart icon, a group of people icon, and another numeric value. The right section displays two circular charts indicating year-over-year revenue and last year's revenue. The bottom row includes a bar chart and a line graph, each with multiple data series. Text placeholders are present for numeric values and labels, aligned centrally within their respective blocks.
How to Use It
This layout serves as a performance dashboard, displaying key metrics and visualizations for sales management. It fits well in a presentation sequence that summarizes sales data or performance analysis. Real-world applications include quarterly sales reviews, team performance assessments, or financial summaries. This structure allows for quick comparisons and highlights important statistics, making it suitable for executive updates or team meetings focused on sales outcomes.
Text Placeholders & Capacity
Keep your copy within these limits so it fits without resizing. Node body slots can hold roughly 10 characters each.
| Placeholder | Count | Max characters (approx.) |
|---|---|---|
| Item body | 6 | 10 |
| Item heading | 2 | 15 |
| Chart title | 2 | 20 |
Slide Keywords
Download unlimited PowerPoint templates, charts and graphics for your presentations with our annual plan.
DOWNLOADReturn to Free Sales Management Dashboard PowerPoint Template.