Cycle Time PowerPoint Template
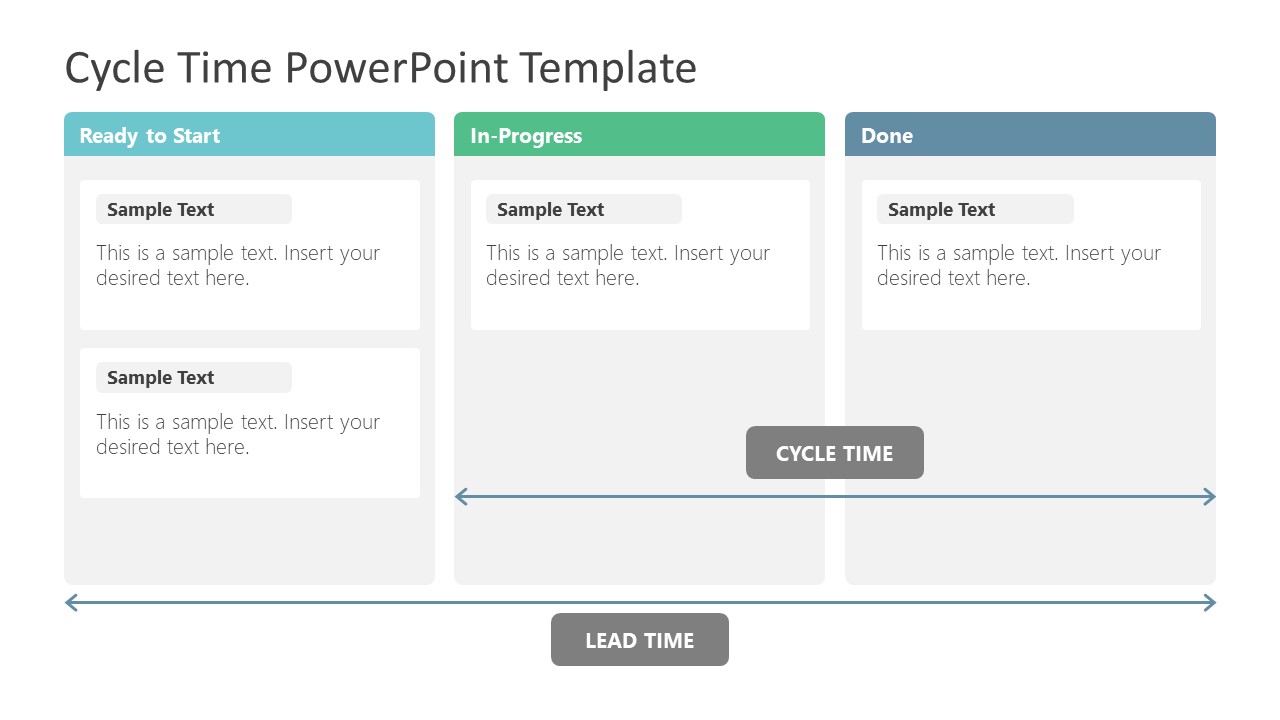
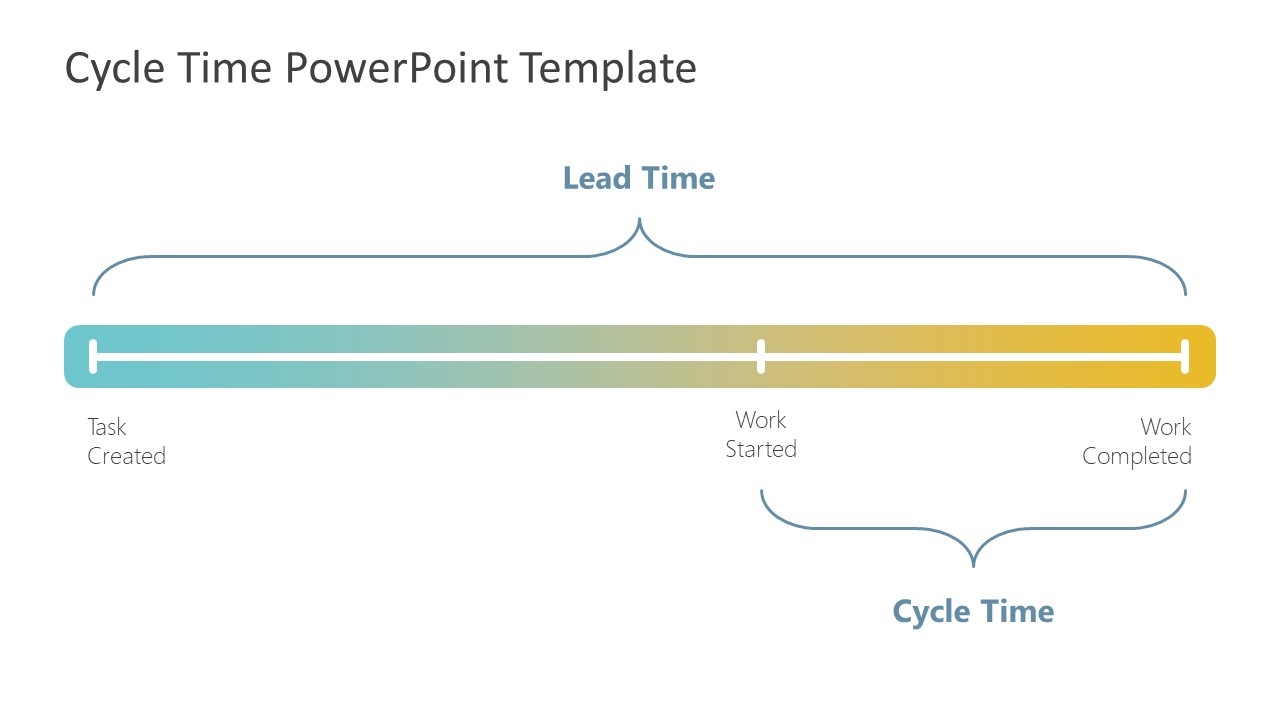
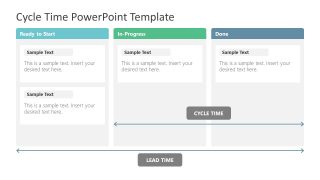
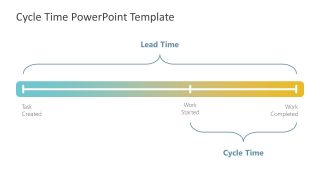
The Cycle Time PowerPoint Template presents diagrams for lead time and cycle time in manufacturing and development projects. It is a timeline and planning PowerPoint of three-stage process. Cycle time is the time it takes from initiation to successfully delivering one task or product. It is calculated from the start to finish time for an operation. Whereas, the lead time is calculated from the time of request to and ends with delivery. The simplest example of cycle time and lead time is takeaway food shop. The time it takes to complete one order is cycle time, whereas, time from customer’s order to delivery is lead time.
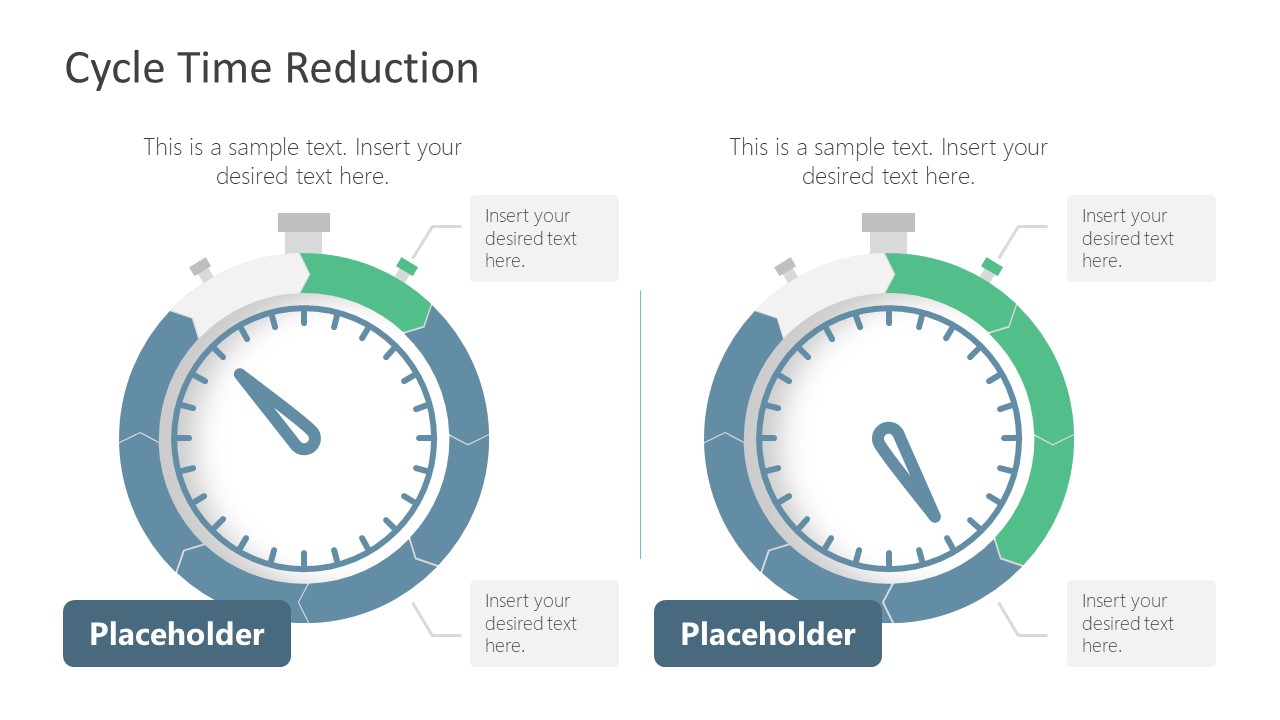
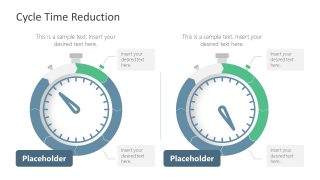
The cycle time is an important concept in manufacturing process planning. In manufacturing operations, bottlenecks within processes can cause productivity loss. One way of eliminating problems and improving productivity is CTR. Cycle time reduction (CTR) is the method of finding efficient ways to deliver product at a low cost.
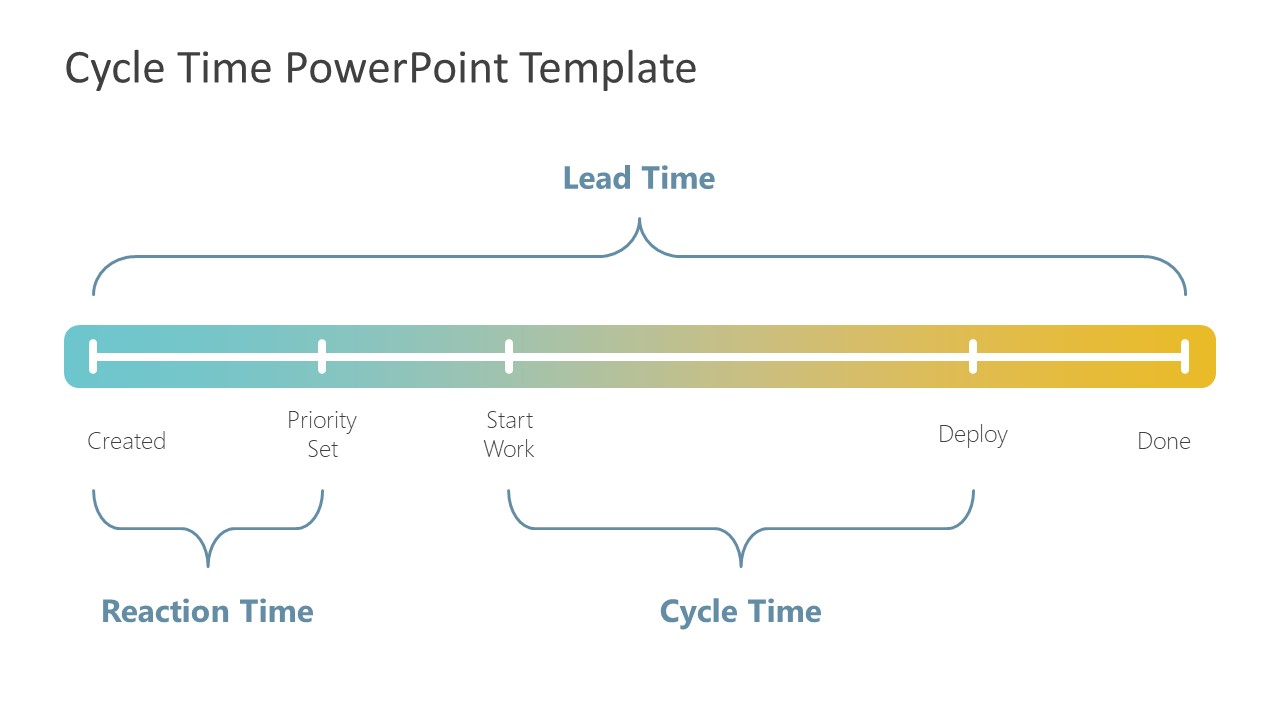
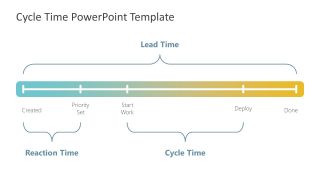
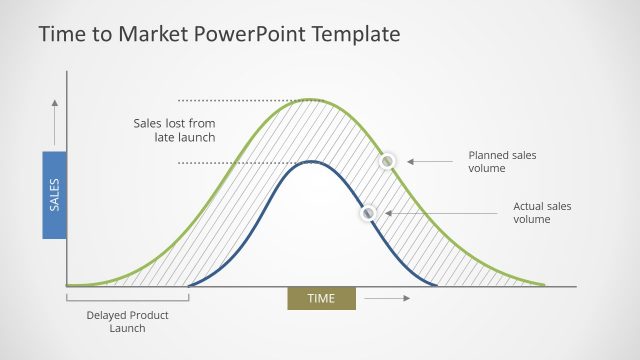
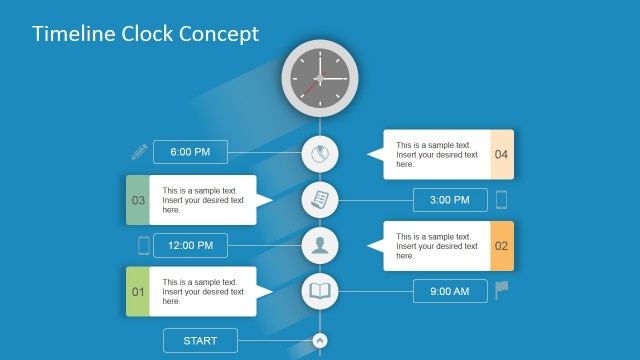
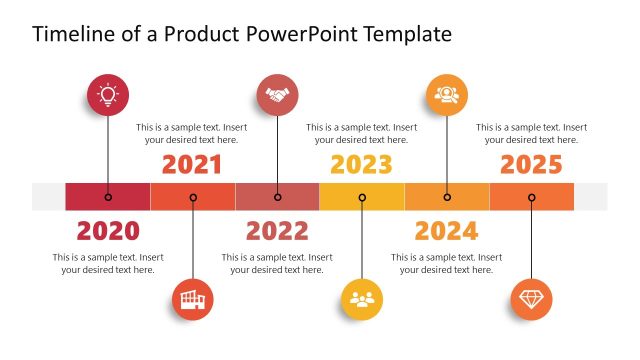
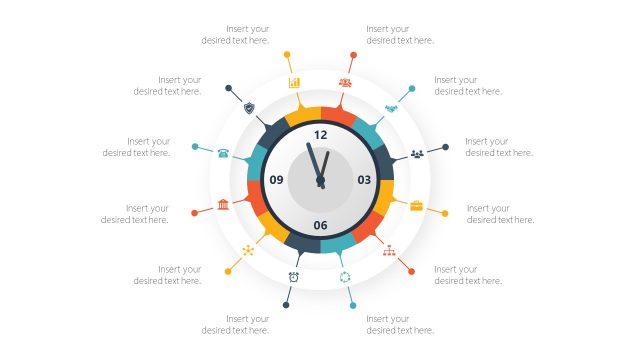
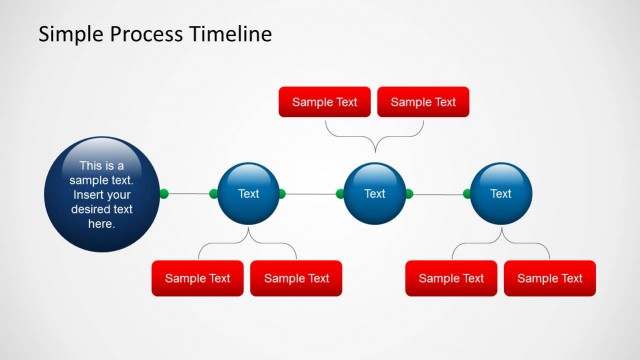
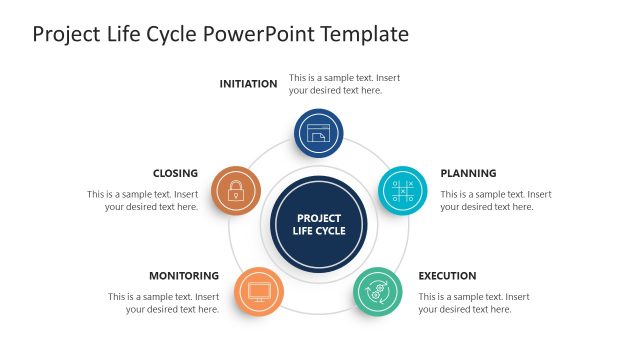
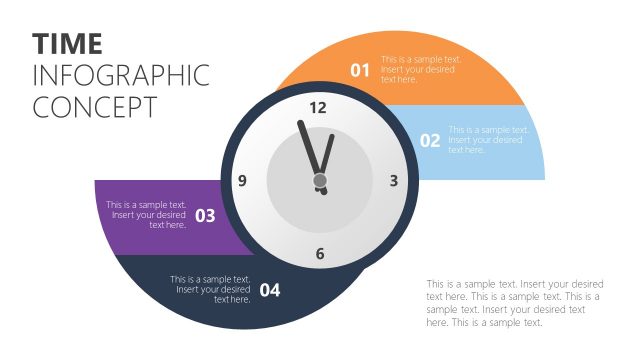
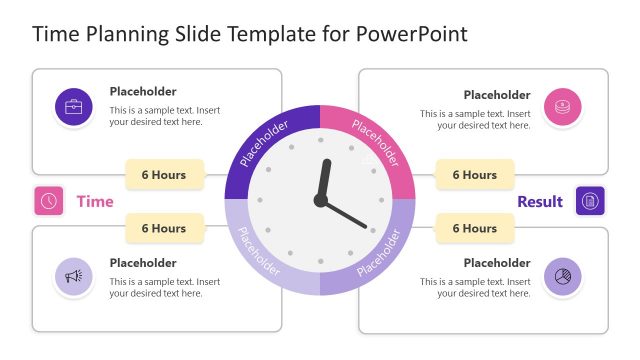
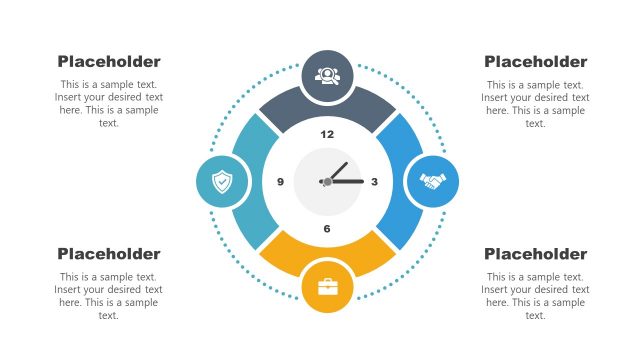
The PowerPoint templates of cycle time contain four slides illustrating cycle and lead time. These slides depict timeline and process cycles with different types of milestones. Based on industry type and product delivery process, you can copy cycle time PowerPoint slide. Simply change the textual content and modify layout colors according to presentation data.
The Cycle Time PowerPoint Template features three phases of product life cycle i.e. start, in-progress, and done. There are two slides of timeline dialer that will let you change time of each phase by changing milestone pointers. The additional stop-watch templates could be used for optimizing cycle time. You can discuss methods of Cycle Time Reduction (CTR) using stopwatch PowerPoint shapes.
