Slide 3 of 3 from CVP Graph PowerPoint Template
CVP Graph Presentation Template
Cost-Volume-Profit Chart Slide
- Chart
- Other
- Financial Summary Slide
- 16:9
- 100% Editable
What’s on This Slide
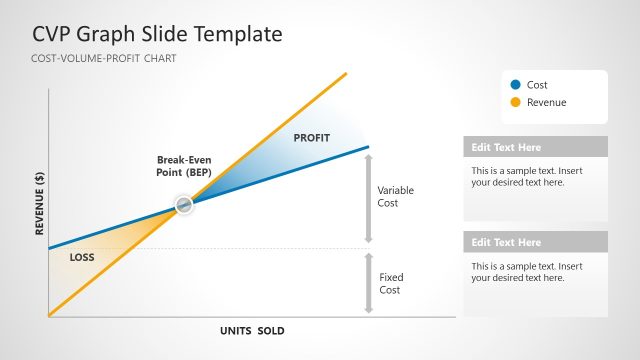
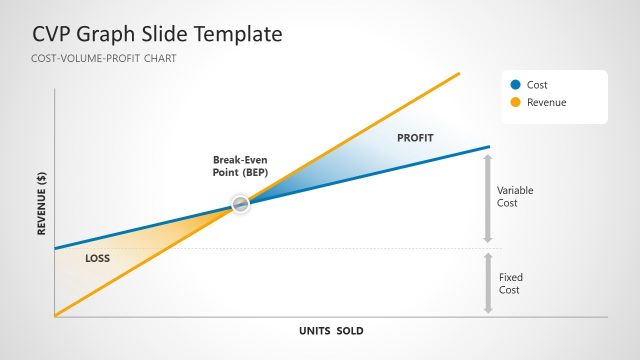
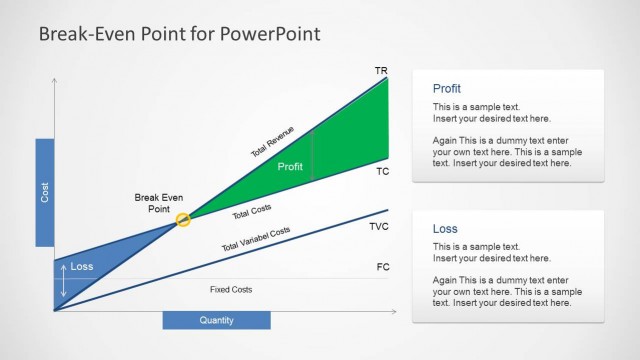
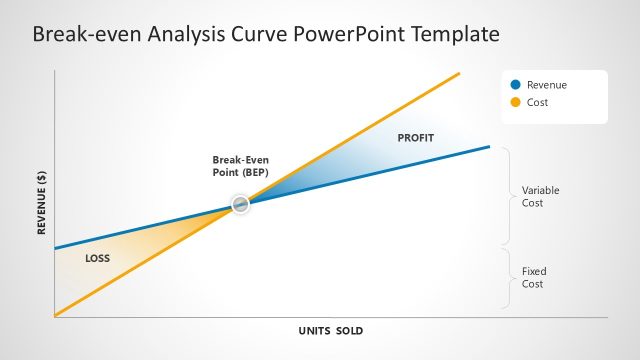
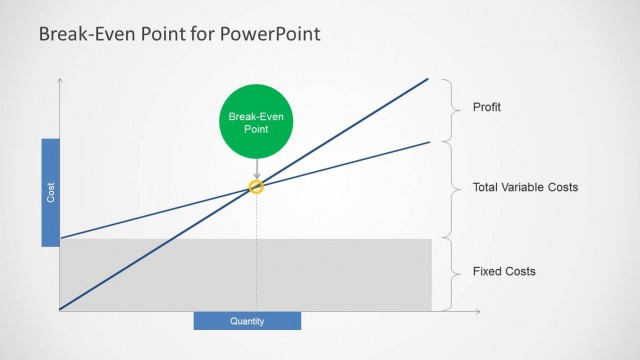
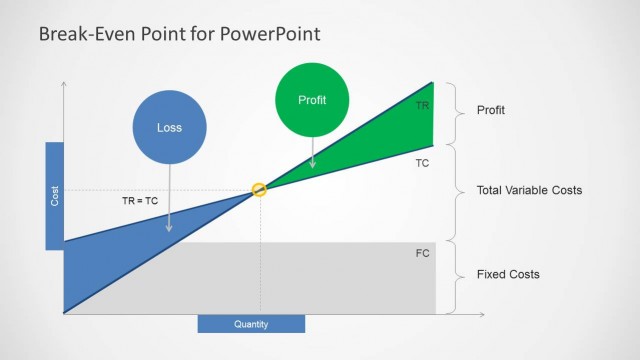
The layout features a cost-volume-profit chart with a diagonal line representing profit and revenue. The vertical axis indicates revenue in dollars, while the horizontal axis shows units sold. A break-even point is marked on the graph, with labels for loss, profit, variable cost, and fixed cost positioned appropriately. Text placeholders are present for titles and descriptions, aligned to the right. The background is light, enhancing the visibility of the colored lines, which are blue for revenue and orange for costs, creating a clear visual hierarchy.
How to Use It
This layout serves as a cost-volume-profit analysis tool, illustrating the relationship between costs, volume, and profit. It fits well in a financial presentation, particularly in discussions about pricing strategies or sales forecasts. This slide can be used to explain break-even analysis in business scenarios, helping stakeholders understand profit margins and cost structures. It is suitable for financial reports, sales meetings, or strategic planning sessions.
Text Placeholders & Capacity
Keep your copy within these limits so it fits without resizing. Text slots are moderate, with body text fitting around 15-20 words each.
| Placeholder | Count | Max characters (approx.) |
|---|---|---|
| Slide title | 1 | 40 |
| Body paragraph | 1 | 100 |
| Item heading | 4 | 30 |
Slide Keywords
Download unlimited PowerPoint templates, charts and graphics for your presentations with our annual plan.
DOWNLOADReturn to CVP Graph PowerPoint Template.