Slide 9 of 12 from Creative Business Presentation Template
Financial Overview Dashboard Slide – Business Presentation Template
Financial Overview Slide for Business Presentation
- Chart
- Bar Vertical
- Financial Summary Slide
- 16:9
- 100% Editable
What’s on This Slide
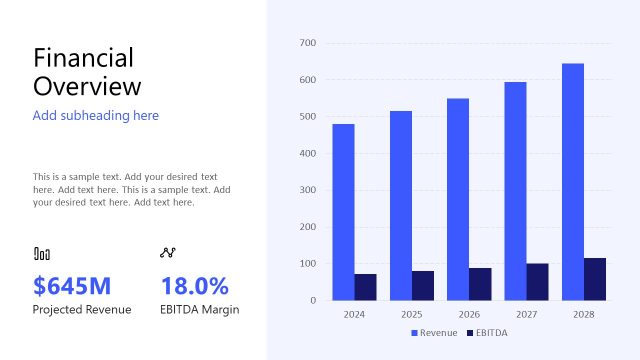
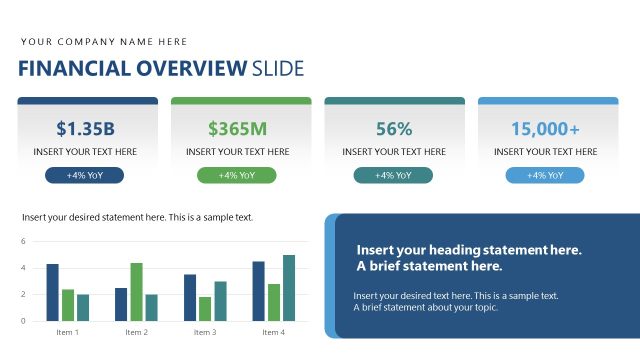
The layout features a title at the top center, labeled 'Financial Overview.' Below, there are three rectangular boxes aligned horizontally, each containing key financial metrics: Revenue, Gross Margin, and Net Profit. Each box has an icon and numerical data with percentage changes. Below these boxes, a bar chart on the left displays revenue projections from FY22 to FY29, while a line chart on the right illustrates profitability trends over the same period. Text placeholders exist for axis labels and chart titles, with a light background gradient enhancing the visual hierarchy.
How to Use It
This layout serves to present financial data clearly, making it suitable for executive updates or pitch discussions. It can be used to summarize key financial metrics and trends, fitting well after a market analysis slide. In a business context, it is ideal for showcasing revenue growth, profitability, and projections, helping stakeholders understand financial performance at a glance.
Text Placeholders & Capacity
Keep your copy within these limits so it fits without resizing. Text slots are moderate, allowing concise data presentation.
| Placeholder | Count | Max characters (approx.) |
|---|---|---|
| Slide title | 1 | 20 |
| Item heading | 3 | 15 |
| Item body | 3 | 25 |
| Chart title | 2 | 30 |
| Axis label | 2 | 20 |
Slide Keywords
Download unlimited PowerPoint templates, charts and graphics for your presentations with our annual plan.
DOWNLOADReturn to Creative Business Presentation Template.