Slide 8 of 12 from Path to Success PowerPoint Template
Performance Matrix Slide with Data Charts for Path to Success Template
Performance Metrics Overview for Success Tracking
- Chart
- Other
- Evaluation Slide
- 16:9
- 100% Editable
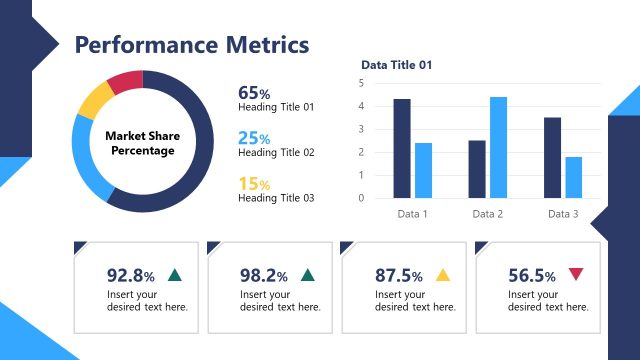
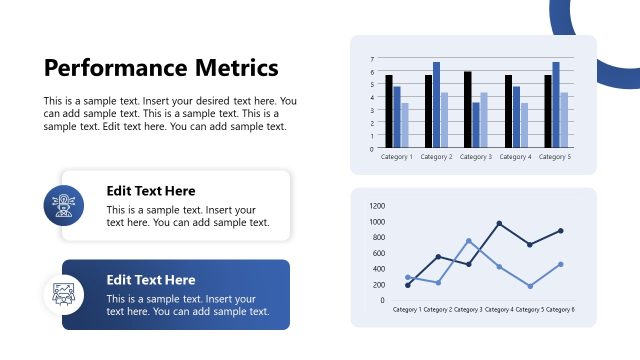
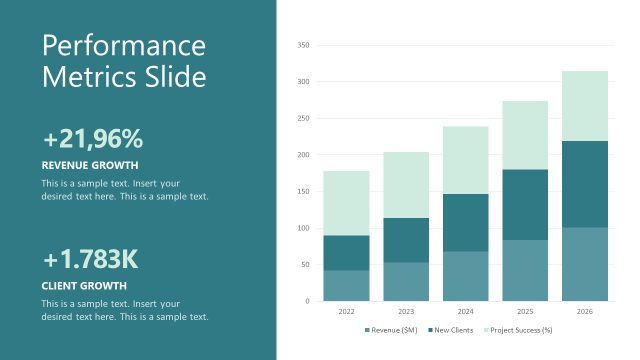
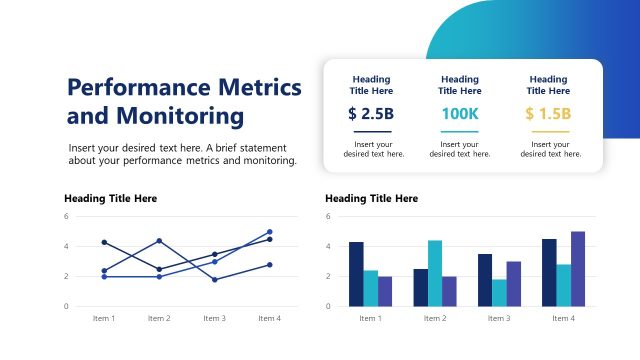
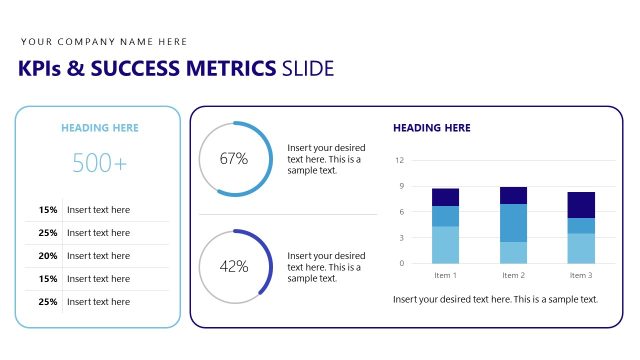
The Performance Metrics Slide from the Path to Success PowerPoint Template provides a clear layout for evaluating key performance areas using circular progress indicators and vector icons. Designed for business presentations and strategic planning, this slide template supports effective communication of project updates and performance reviews through editable slides with a professional blue color scheme.
What’s on This Slide
The layout features a left section with key performance areas listed vertically, including icons for each area. The right section contains four circular progress indicators, each representing different metrics. The title is positioned at the top center, with a bold font. Text placeholders are present for each metric, aligned to the right of their respective indicators. The overall composition is structured with a clean division between the left and right sections, utilizing a blue color scheme for visual emphasis. Background elements include a subtle mountain design at the bottom.
How to Use It
This layout serves as a performance metrics overview, suitable for tracking progress in various key areas. It fits well after a problem-framing slide and before a roadmap slide in a presentation sequence. This structure is ideal for business scenarios like project updates, performance reviews, or strategic planning sessions, where clear metrics are essential for decision-making and stakeholder communication.
Text Placeholders & Capacity
Keep your copy within these limits so it fits without resizing. Node labels can hold about 3-4 words each, while body text is tighter.
| Placeholder | Count | Max characters (approx.) |
|---|---|---|
| Slide title | 1 | 30 |
| Item heading | 5 | 20 |
| Item body | 5 | 50 |
| Chart title | 4 | 20 |
Slide Keywords
Download unlimited PowerPoint templates, charts and graphics for your presentations with our annual plan.
DOWNLOADReturn to Path to Success PowerPoint Template.