Circular Timeline Infographic Template for PowerPoint
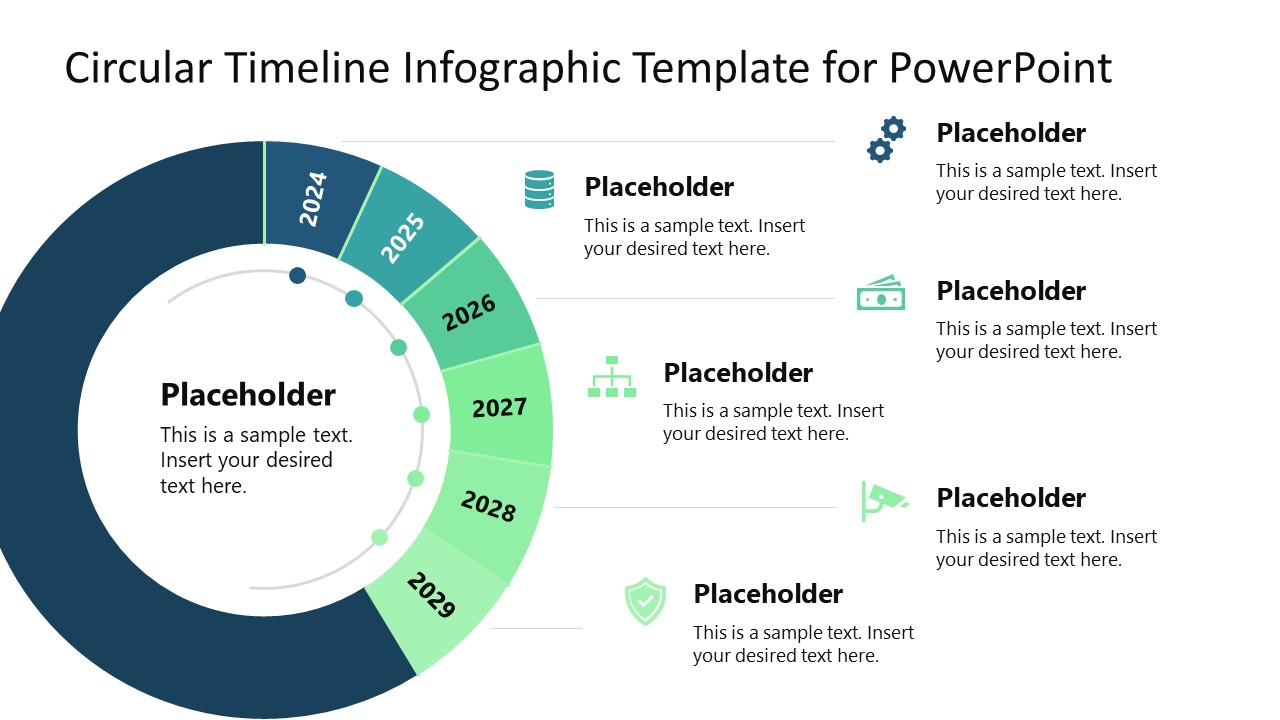
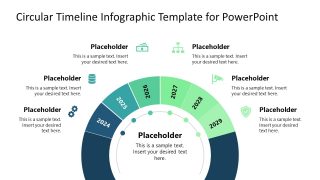
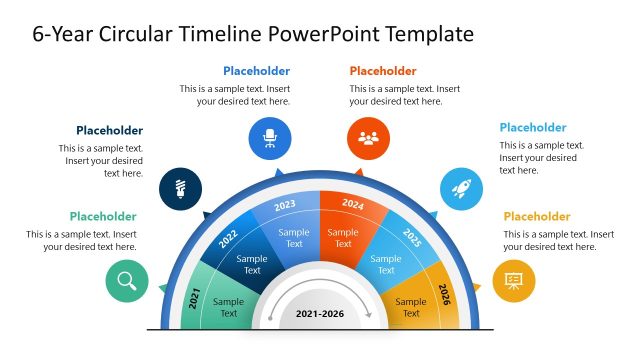
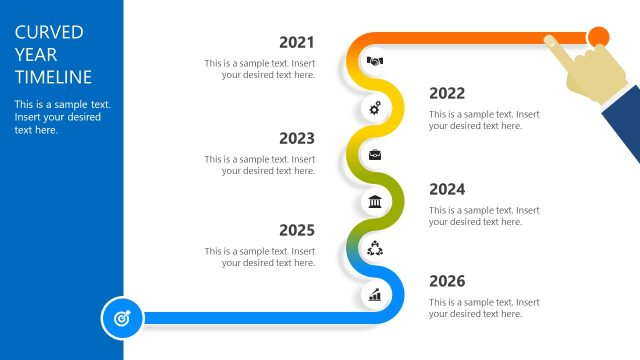
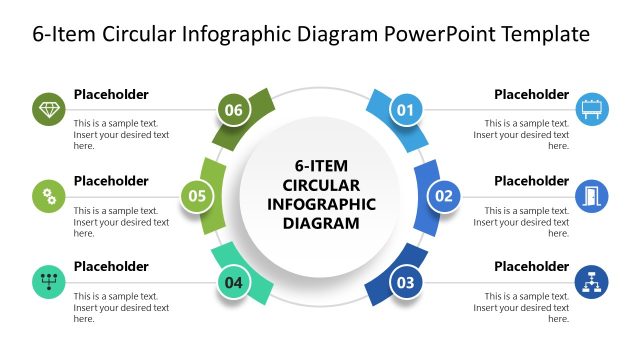
The Circular Infographic Template for PowerPoint contains a circular ring diagram having six segments. This timeline model can be customized to prepare a 6-year progress report of an organization or to prepare. Also, the sequence of events, stages of a project, or different steps of an action plan can be explained in a circular fashion using this template. It is a perfect choice for professionals who want to present a summary of yearly achievements before the company executives.
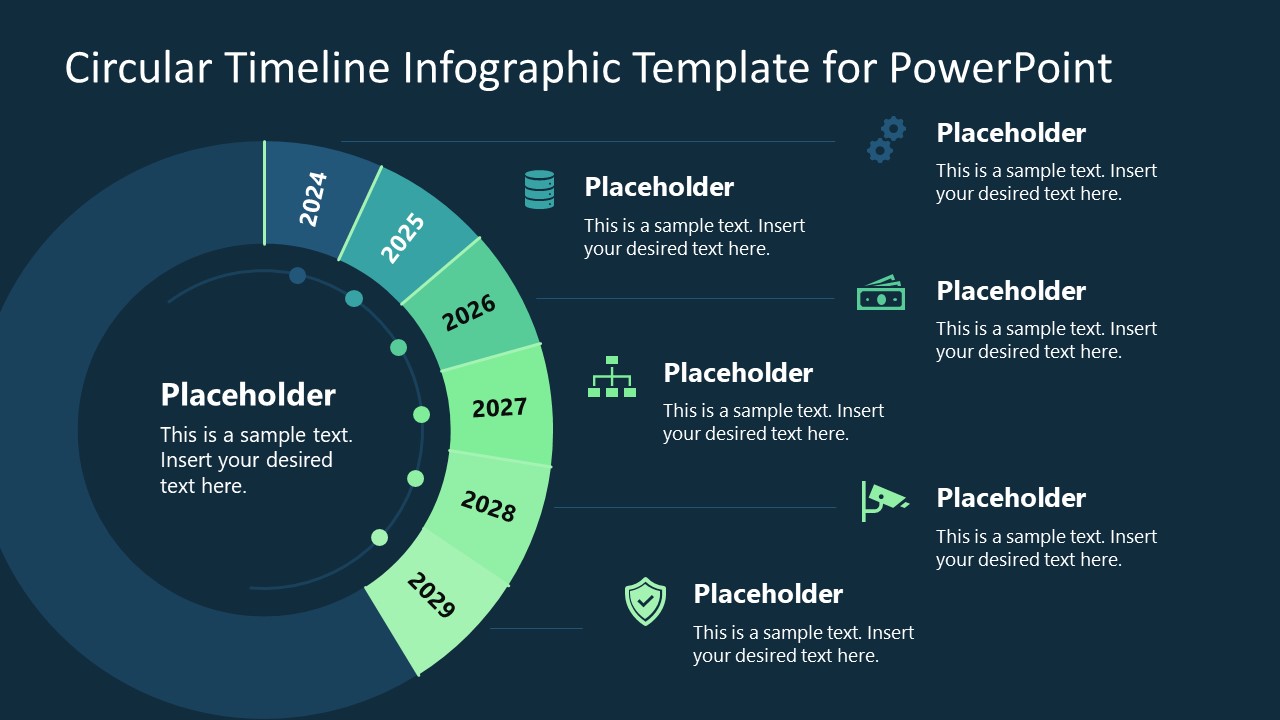
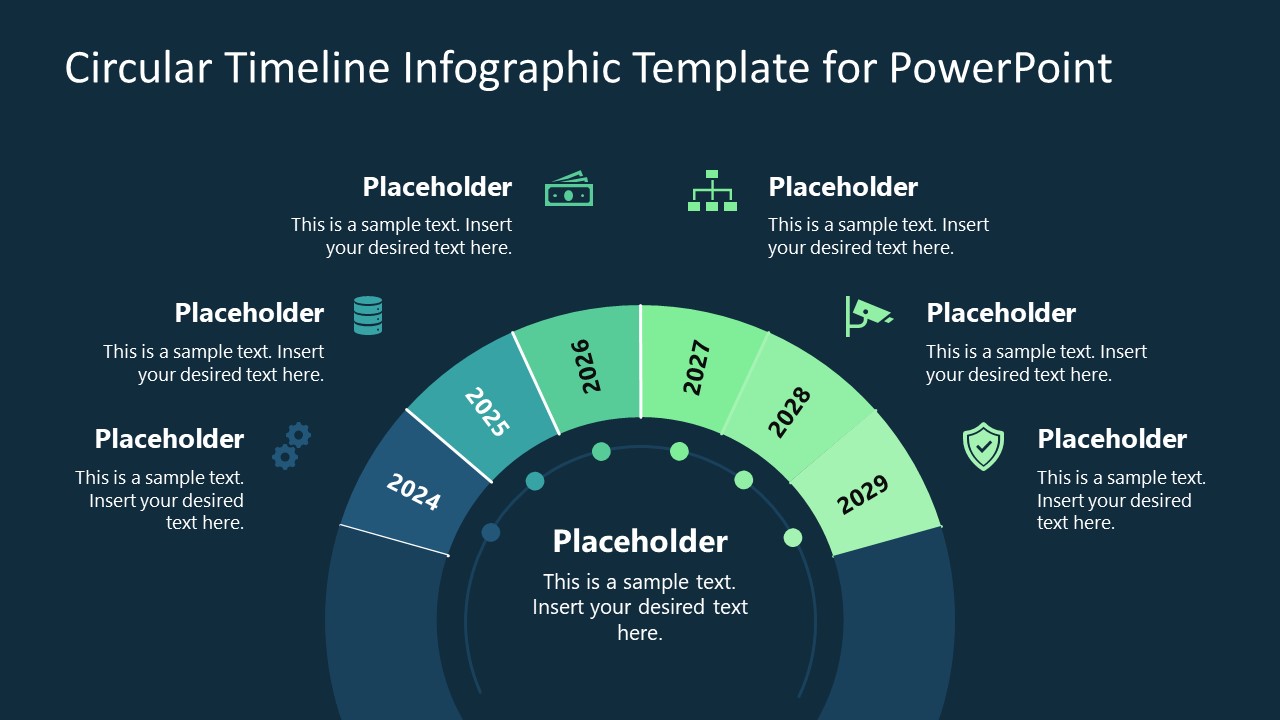
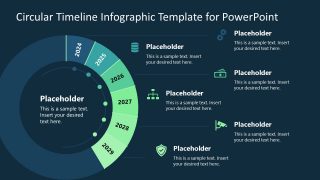
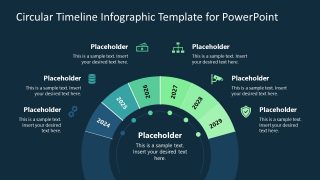
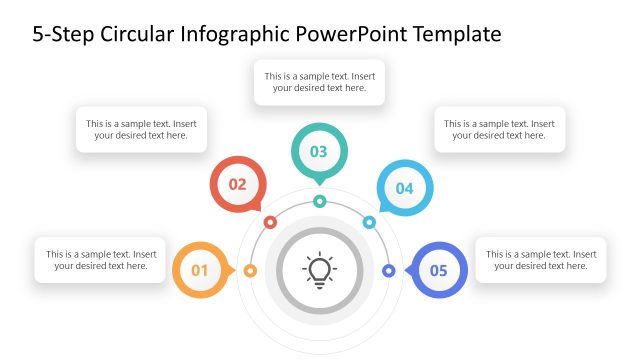
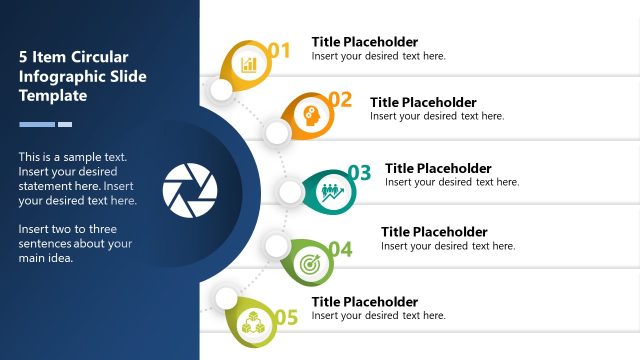
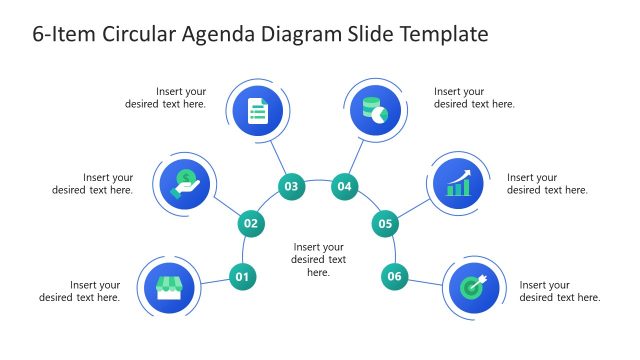
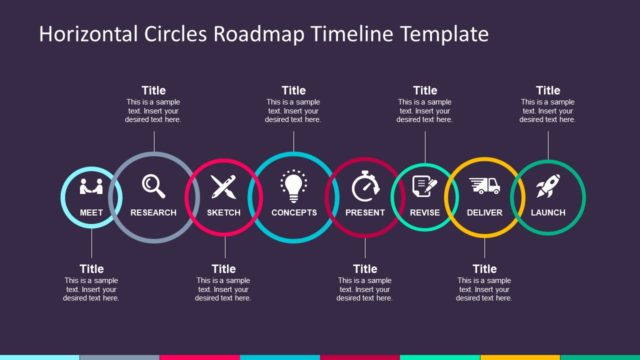
There are two design variations of this circular timeline model—each with a different position of the circular diagram on the slide. In the first layout, the circular model is placed on the left-hand corner, while in the second one, it is positioned on the lower side. The circumference of this round figure shows a segmented pattern where each segment displays a specific step or stage of the timeline. A text box is placed with each phase where users can add the description. The color gradient in the outline of this circular shape enhances the overall design. For visual elaboration, each segment is marked with a relevant graphic icon to make the template engaging for the audience.
The Circular Timeline Infographic Template for PowerPoint can be used by business personnel, sales & marketing professionals, and project managers. Using this model, they can present their future strategies, yearly accomplishments, or annual reports. This circular timeline illustration PowerPoint Template can also be used to discuss the upcoming years’ market growth and business goals. Alternatively, you can download other timeline slide designs for presentations, timeline infographics or learn how to make a visually engaging timeline for your presentations.
Users can choose between the two background color variants of this slide. And they can customize the clipart icons, shapes, and colors accordingly. This infographic PPT template contains text boxes and is 100% editable using PowerPoint and Google Slides.
