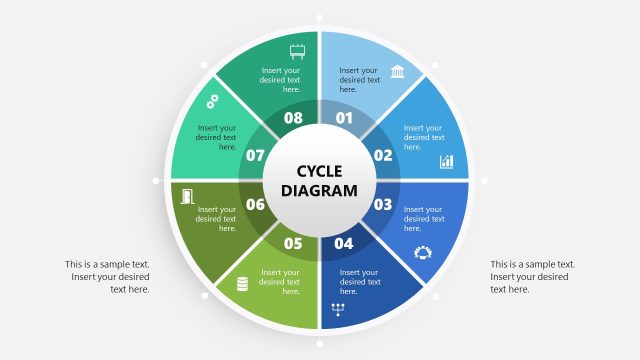
Creative 8 Step Cycle Diagram for PowerPoint
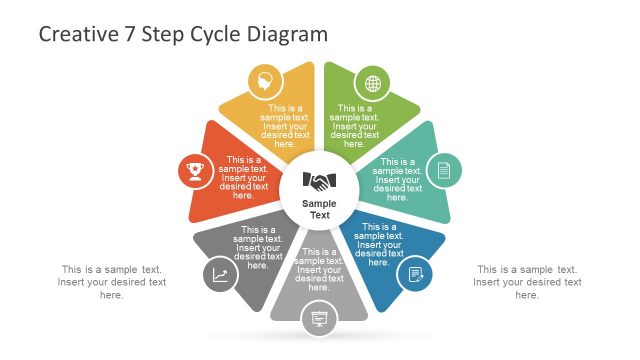
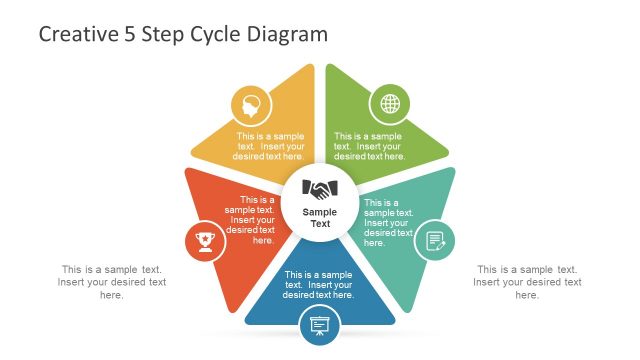
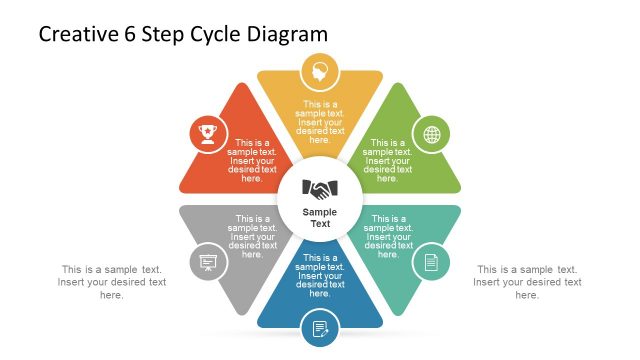
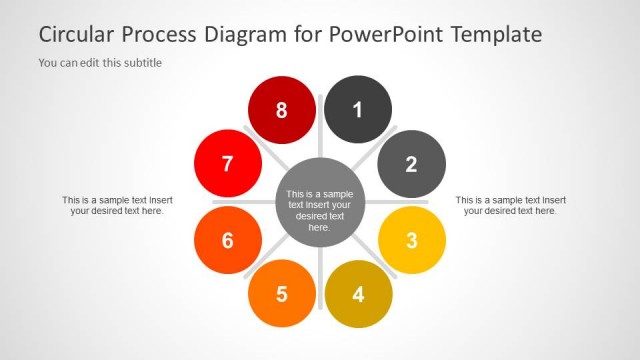
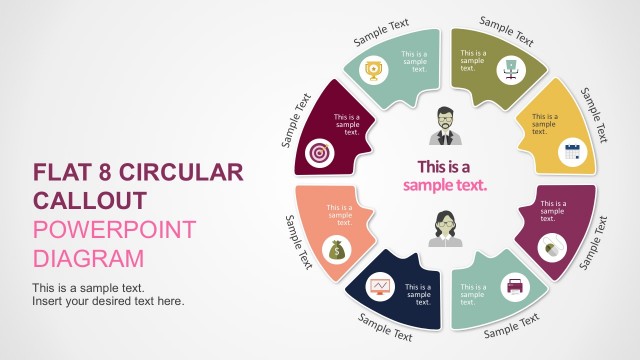
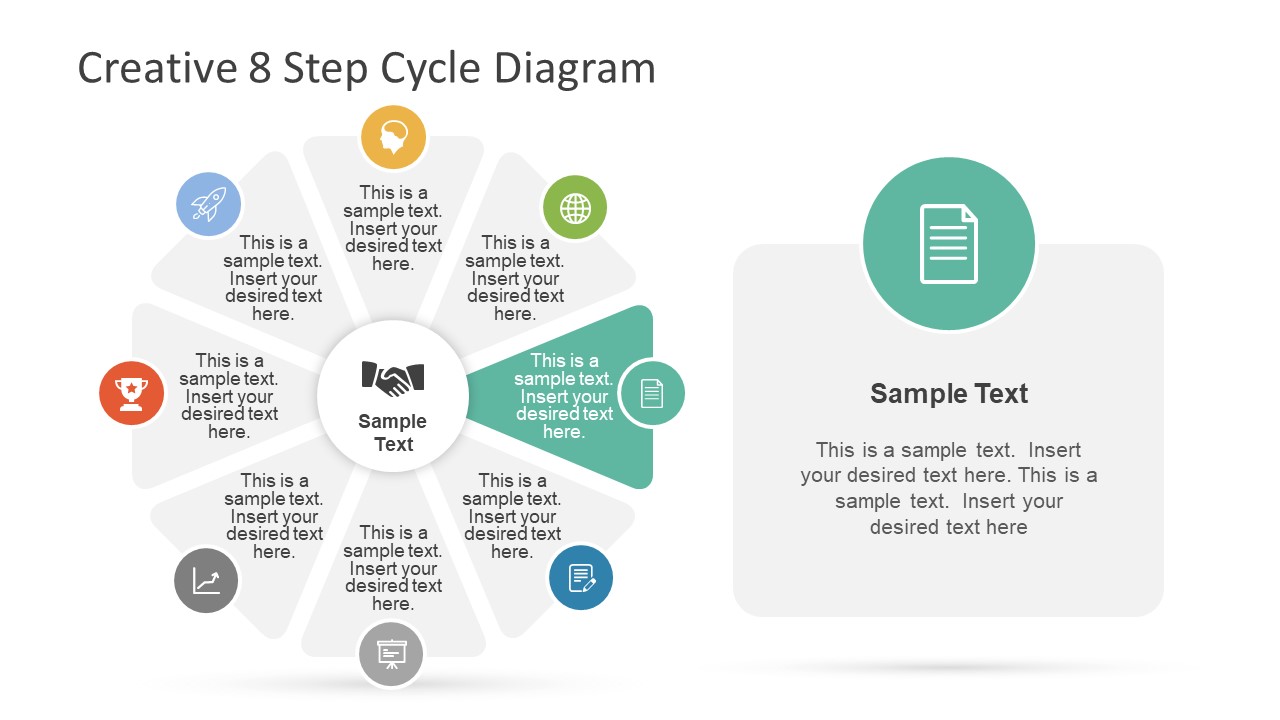
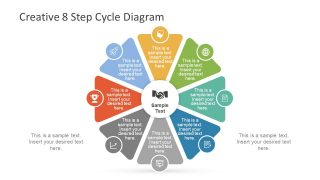
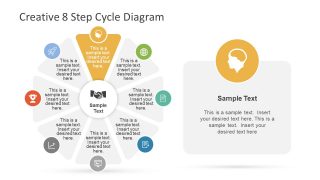
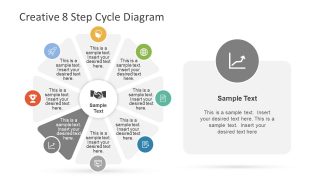
The Creative 8 Step Cycle Diagram is an incredible template for presenting process information in circular visual format. The circular segment diagram is an easy way to display a project or product’s strategic model life cycle. The most common applications of circular flow diagrams are relevant to financial activities, such as processes involving goods and services, i.e., marketing, sales, customer feedback, and analysis. This creative cycle of 8 steps can help present a repetitive model, such as continuous improvement or change management. Further, this PowerPoint template can also aid as a guide for new employees to understand the operations cycle of the organization. There are various other presentation options like the food chain, social behavior, roadmaps, etc.
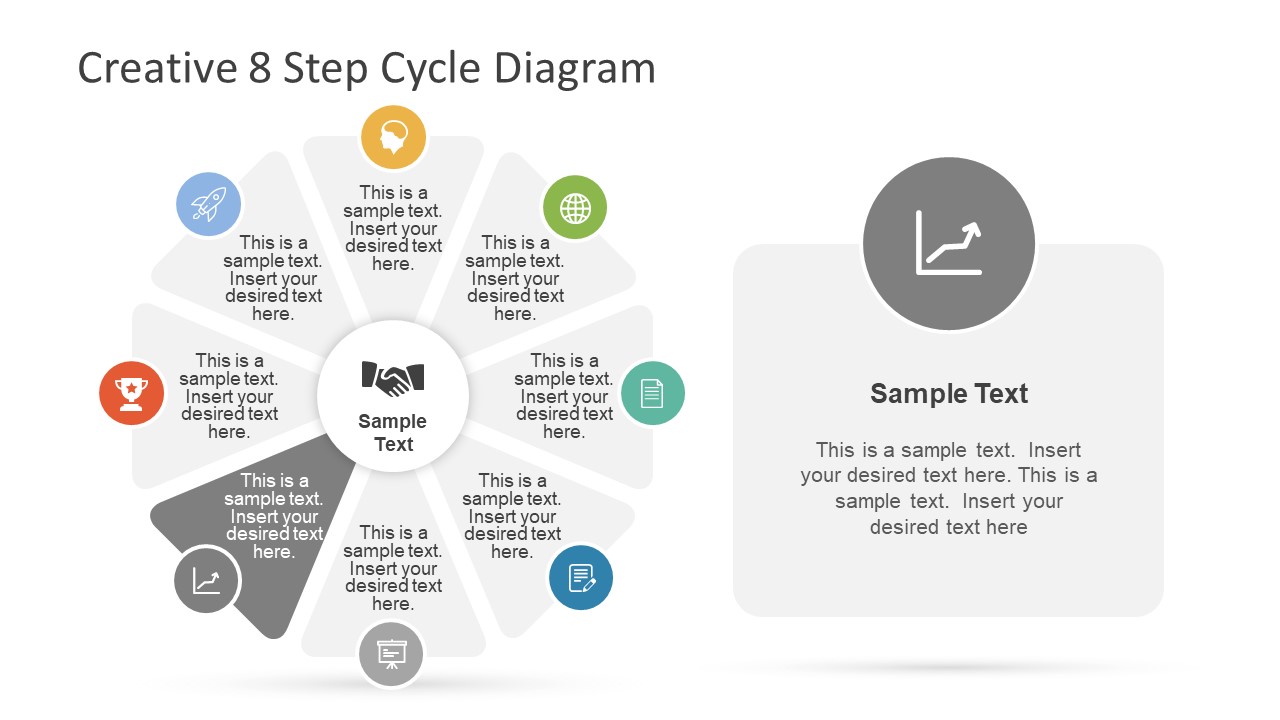
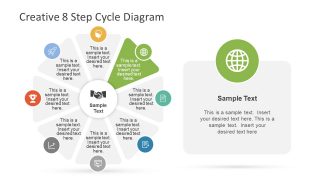
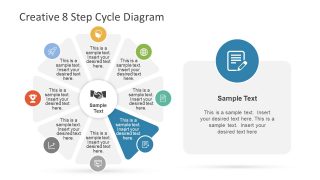
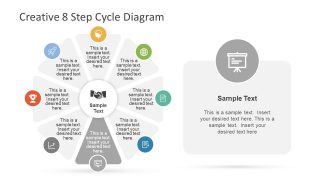
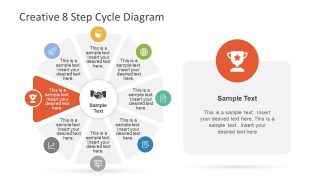
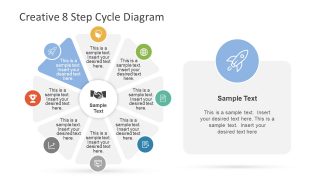
The Creative 8-Step Cycle Diagram contains 9 amazing slides of circular process flow PowerPoint. The main slide gives an overview of colorful triangular segment shapes. However, there are subsequent templates to describe the elements of each section of the diagram in detail. This presentation style is a visual aid for the audience to focus on individual parts of the 8-step model per slide. The triangle segments of this PowerPoint diagram have circular infographics to represent them graphically. These icons include a human head, globe, report, document, slideshow, trend chart, trophy, and rocket. The layout of this creative diagram has a beautiful design for the placeholders, useful for adding key points.
This fully customizable PowerPoint diagram of creative 8-step is a high-quality template enabling users to edit the most basic elements. For instance, modify the colors of triangular shapes, circular icons or infographics by choosing from shape fill. Also, resize the cycle diagram template figures, move or replace the icons with mouse clicks. Similarly, insert objects like contact information, logo images or spreadsheets to display numerical data for information given in PowerPoint. Alternatively, you can download other presentation slide templates for PowerPoint & Google Slides with creative diagrams.


You must be logged in to download this file.
DOWNLOAD- Category
- Diagrams
- Rating


 Loading...
- Size
- 16x94x3
- Item ID
- 7571-01
- Colors
Subscribe today and get immediate
access to download our PowerPoint templates.