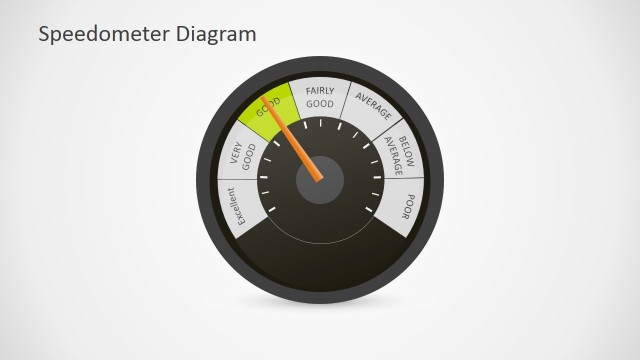
Slide 3 of 3 from Circular Blue Dashboard PowerPoint Speedometer
Blue Dashboard Speed Inflation PowerPoint Template
Circular Blue Dashboard Speedometer Slide
- Chart
- Gauge Meter
- Kpi Reporting Slide
- 16:9
- 100% Editable
What’s on This Slide
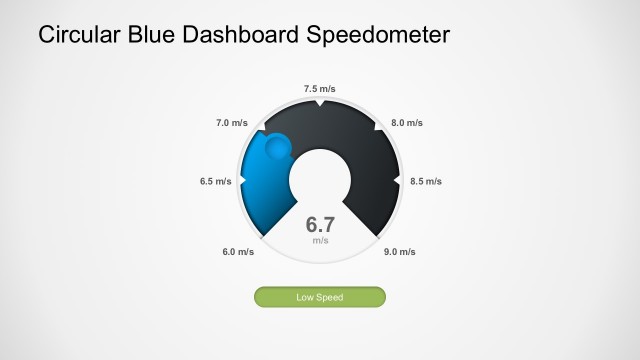
The slide features a circular speedometer gauge positioned centrally. It displays a measurement of 8.3 m/s, highlighted prominently in the middle. Surrounding the gauge are incremental values ranging from 6.0 to 9.0 m/s, evenly spaced along the circular edge. A colored segment indicates the current speed, transitioning from blue to black. Below the gauge, a red button labeled 'Critical Speed' is centered, serving as a callout. The background is a light color, enhancing the visibility of the gauge and text elements.
How to Use It
This layout serves as a quantitative measurement display, ideal for showcasing performance metrics or KPIs. It fits well in presentations focused on progress tracking, performance evaluation, or operational metrics. This slide can be used in business contexts such as project updates, performance reviews, or dashboard presentations, where quick visual insights are necessary. It is particularly effective when emphasizing critical thresholds or targets in operational settings.
Text Placeholders & Capacity
Keep your copy within these limits so it fits without resizing. The chart title slot can hold a short phrase, while the node body is tight for numeric values.
| Placeholder | Count | Max characters (approx.) |
|---|---|---|
| Chart title | 1 | 30 |
| Item body | 1 | 10 |
| Callout | 1 | 15 |
Slide Keywords
Download unlimited PowerPoint templates, charts and graphics for your presentations with our annual plan.
DOWNLOAD