Slide 1 of 3 from Circular Blue Dashboard PowerPoint Speedometer
Editable Blue Speedometer Gauge PowerPoint Shapes
Circular Blue Dashboard Speedometer Slide
- Chart
- Gauge Meter
- Kpi Reporting Slide
- 16:9
- 100% Editable
What’s on This Slide
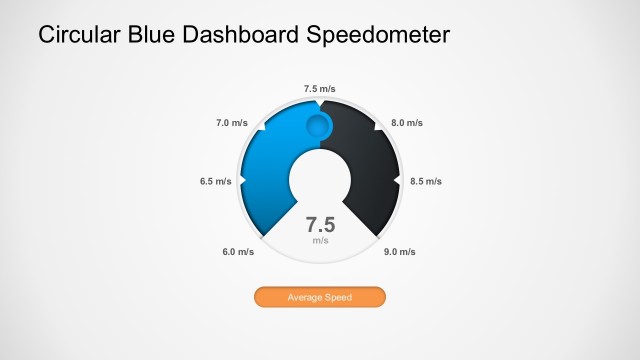
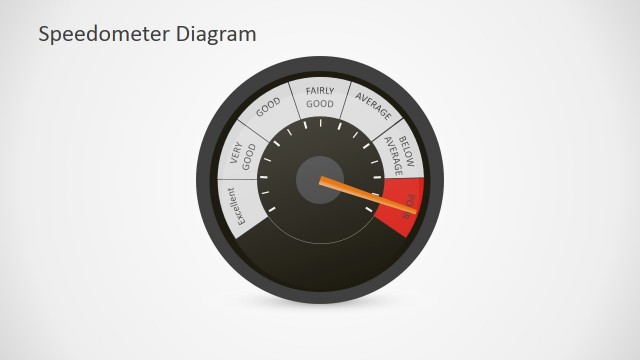
The slide features a circular speedometer gauge centered on the page. The gauge displays a range from 6.0 to 9.0 m/s, with tick marks at each interval. A blue indicator points to 6.7 m/s, positioned slightly to the left of center. Below the gauge, a green button labeled 'Low Speed' is centrally aligned. The background is light gray, providing contrast to the dark and blue elements of the gauge. The overall layout is clean, with a clear visual hierarchy emphasizing the speed reading.
How to Use It
This layout serves as a speedometer gauge to visually represent performance metrics or KPIs. It fits well in presentations that track progress or performance over time. This slide is useful in business contexts such as project updates, performance reviews, or operational dashboards. It can effectively communicate whether a metric is within an acceptable range or needs attention, making it suitable for executive summaries or team meetings.
Text Placeholders & Capacity
Keep your copy within these limits so it fits without resizing. Text slots are limited, roughly 2-3 words each.
| Placeholder | Count | Max characters (approx.) |
|---|---|---|
| Slide title | 1 | 30 |
| Item body | 1 | 20 |
Slide Keywords
Download unlimited PowerPoint templates, charts and graphics for your presentations with our annual plan.
DOWNLOAD