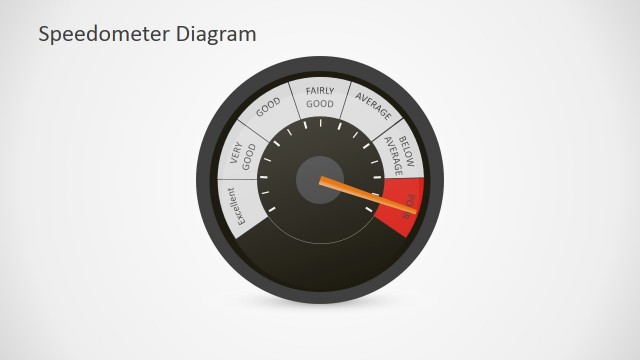
Slide 2 of 3 from Circular Blue Dashboard PowerPoint Speedometer
Blue Creative PowerPoint Speedometer Charts
Circular Blue Dashboard Speedometer Slide
- Chart
- Gauge Meter
- Kpi Reporting Slide
- 16:9
- 100% Editable
What’s on This Slide
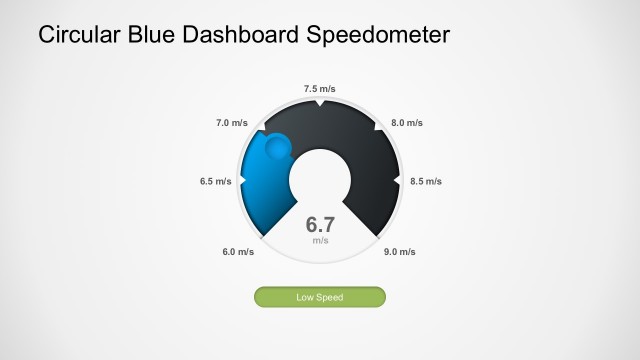
The layout features a circular speedometer with a gradient color scheme of blue and black. The speedometer displays values ranging from 6.0 m/s to 9.0 m/s, with a highlighted reading of 7.5 m/s in the center. The numbers are positioned evenly around the circular gauge, with the current speed indicated prominently. Below the gauge, there is a rounded orange button labeled 'Average Speed.' Text placeholders exist for the title at the top and the button label, aligned centrally within their respective areas.
How to Use It
This layout serves as a quantitative measurement tool, ideal for presenting key performance indicators or metrics. It fits well in a presentation sequence after problem identification, providing a visual representation of performance data. This slide is suitable for business contexts such as performance tracking, project updates, or operational metrics, where quick visual insights are necessary to convey average values effectively.
Text Placeholders & Capacity
Keep your copy within these limits so it fits without resizing. The title slot can hold about 30 characters, while the body slot holds around 10 characters.
| Placeholder | Count | Max characters (approx.) |
|---|---|---|
| Slide title | 1 | 30 |
| Item body | 1 | 10 |
| Callout | 1 | 15 |
Slide Keywords
Download unlimited PowerPoint templates, charts and graphics for your presentations with our annual plan.
DOWNLOAD