Slide 1 of 1 from By The Numbers PowerPoint Template
Editable By The Numbers PPT Slide Template
Numerical Data Dashboard for Presentations
- Text Layout
- Other
- Evaluation Slide
- 16:9
- 100% Editable
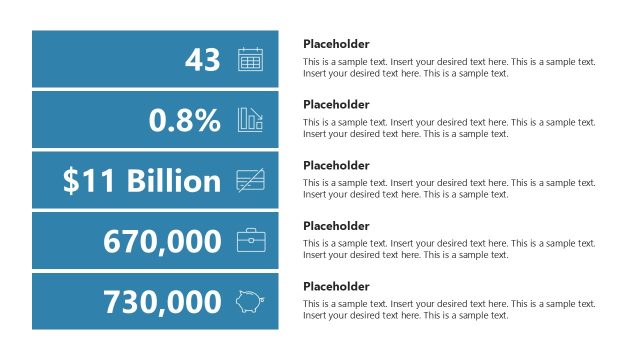
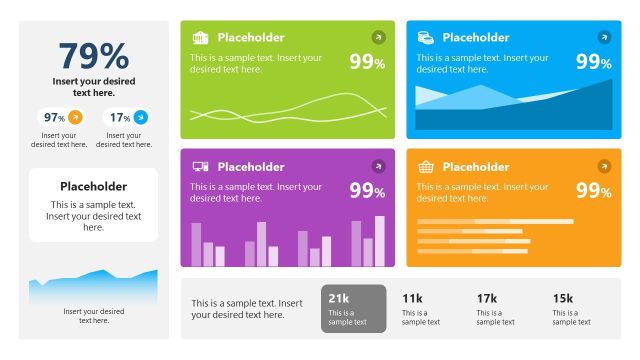
The Numerical Data Dashboard slide from the By The Numbers PowerPoint Template offers a clear layout for presenting key performance indicators and financial summaries. Designed for business presentations, this slide template uses editable shapes and vector icons to highlight numerical data effectively, making it suitable for corporate presentations and pitch decks that require concise visualization of metrics.
What’s on This Slide
The layout features eight rectangular sections arranged in a 2x4 grid. Each section contains a large numerical value, such as percentages or dollar amounts, prominently displayed. Icons accompany some numbers, enhancing visual context. Text placeholders are positioned below each number for descriptive text, aligned centrally. The sections are color-coded with varying shades of blue, teal, and purple, creating a distinct visual hierarchy. The overall composition is clean, with ample white space separating the sections, allowing for easy readability and organization of information.
How to Use It
This layout serves as a KPI dashboard, ideal for presenting key numerical data in a concise manner. It fits well in presentations aimed at stakeholders, analysts, or executives needing quick insights. This structure is effective for summarizing performance metrics, financial data, or survey results. It can be used in business reviews, marketing reports, or project updates, providing a clear snapshot of important figures and trends.
Text Placeholders & Capacity
Keep your copy within these limits so it fits without resizing. Each section can hold a few lines of text, roughly 5-7 words each.
| Placeholder | Count | Max characters (approx.) |
|---|---|---|
| Item body | 8 | 35 |
| Item heading | 8 | 10 |
Slide Keywords
Download unlimited PowerPoint templates, charts and graphics for your presentations with our annual plan.
DOWNLOADReturn to By The Numbers PowerPoint Template.