Slide 1 of 2 from Vertical By The Numbers PowerPoint Template
Editable Vertical By The Numbers PPT Template
Key Performance Indicators Overview Slide
- Text Layout
- List Blocks
- Strategic Analysis Slide
- 16:9
- 100% Editable
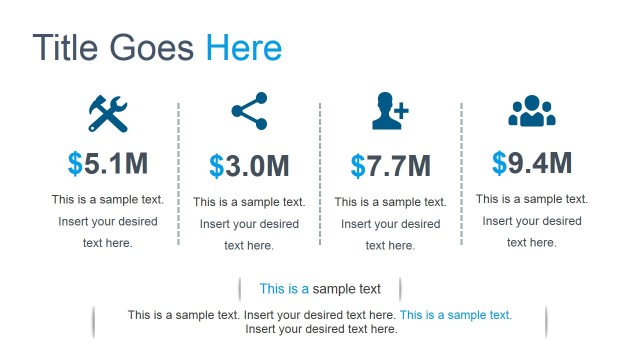
The Key Performance Indicators Overview slide from the Vertical By The Numbers PowerPoint Template offers a structured layout for summarizing essential metrics. Designed for business presentations and project updates, this slide uses editable shapes and vector icons to clearly present numerical data alongside descriptive text. Its vertical format supports quick comparison of performance indicators, making it a practical choice within professional slide decks focused on strategic analysis.
What’s on This Slide
The layout features a vertical arrangement of five distinct data points. Each point includes a numerical value on the left, accompanied by a relevant icon, and a text placeholder for descriptions on the right. The icons are simple and represent various metrics such as time, percentage, financial figures, and quantities. The background is light, with a blue accent for the data points, creating a clear visual hierarchy. The text placeholders are aligned to the right of each number and icon, maintaining a consistent format throughout the slide.
How to Use It
This layout serves as a summary of key performance indicators, ideal for presenting essential metrics in a concise manner. It fits well at the beginning of a presentation to establish context or at the end to summarize findings. This structure is useful in business reports, performance reviews, or project updates where quick data reference is necessary. It allows for easy comparison of different metrics, making it suitable for various analytical scenarios.
Text Placeholders & Capacity
Keep your copy within these limits so it fits without resizing. Each data point can hold a significant amount of text, roughly 15-20 words each.
| Placeholder | Count | Max characters (approx.) |
|---|---|---|
| Item body | 5 | 100 |
| Item heading | 5 | 20 |
Slide Keywords
Download unlimited PowerPoint templates, charts and graphics for your presentations with our annual plan.
DOWNLOADReturn to Vertical By The Numbers PowerPoint Template.