Slide 11 of 13 from Business Development PowerPoint Template
Success Metrics Slide – Business Development PPT Template
Success Metrics Slide for Business Development
- Text Layout
- Other
- Evaluation Slide
- 16:9
- 100% Editable
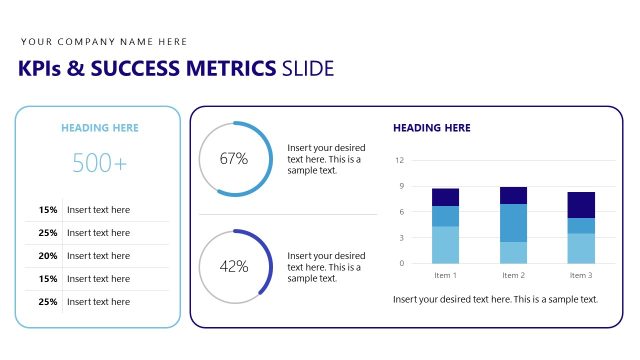
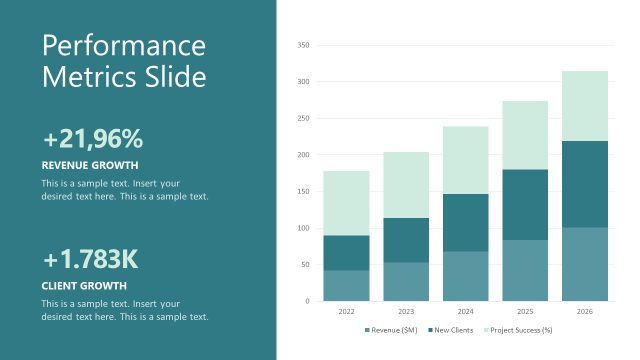
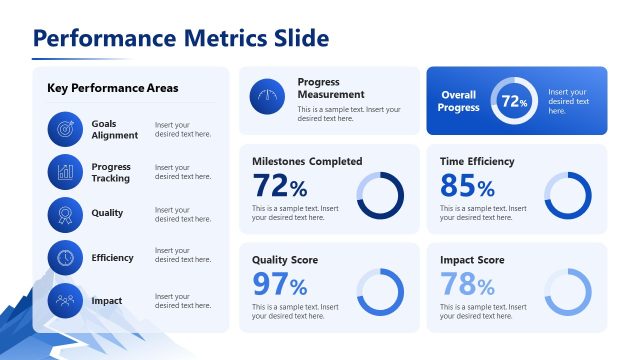
The Success Metrics Slide from the Business Development PowerPoint Template offers a structured layout ideal for presenting key performance indicators during financial reviews or strategic planning sessions. This slide template features editable shapes and a clear visual hierarchy that supports concise communication of project outcomes, making it a practical choice for corporate presentations and business presentation slide decks.
What’s on This Slide
The slide features a grid layout on the left side, displaying three rows of colored squares representing metrics. Each row has a different color gradient, with the top row being light blue, the middle row a medium blue, and the bottom row a dark blue. To the right, there are three sections labeled with dollar amounts, each followed by a text placeholder for descriptions. The title is positioned at the top, with a subheading placeholder below it. The overall composition is balanced, with a clear visual hierarchy between the metrics and descriptions.
How to Use It
This layout serves to present key performance indicators in a structured format. It fits well in a presentation sequence after discussing goals or strategies, providing a clear overview of success metrics. This slide is useful in business contexts where financial performance or project outcomes need to be highlighted, such as quarterly reviews or strategic planning sessions. It allows for easy comparison of metrics alongside descriptive text.
Text Placeholders & Capacity
Keep your copy within these limits so it fits without resizing. Node body slots can accommodate roughly 15-20 words each.
| Placeholder | Count | Max characters (approx.) |
|---|---|---|
| Slide title | 1 | 30 |
| Subtitle | 1 | 50 |
| Item heading | 3 | 10 |
| Item body | 3 | 100 |
Slide Keywords
Download unlimited PowerPoint templates, charts and graphics for your presentations with our annual plan.
DOWNLOADReturn to Business Development PowerPoint Template.