Bridge Map PowerPoint Template
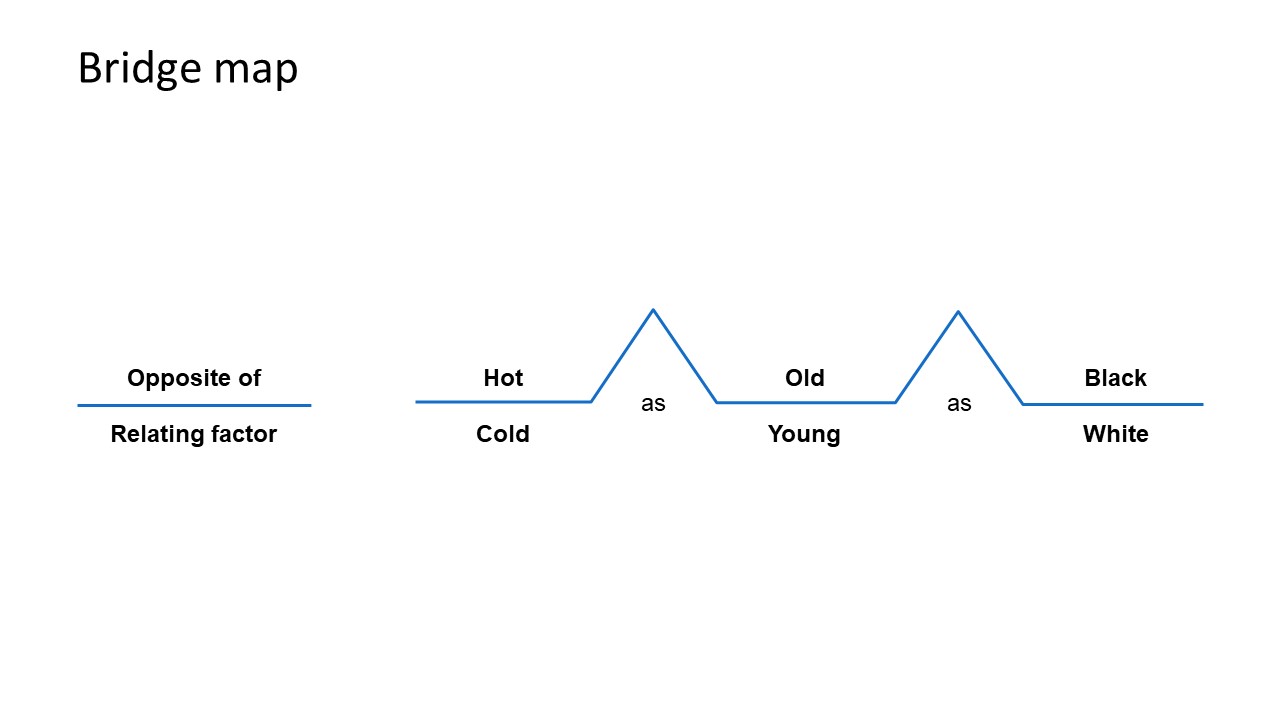
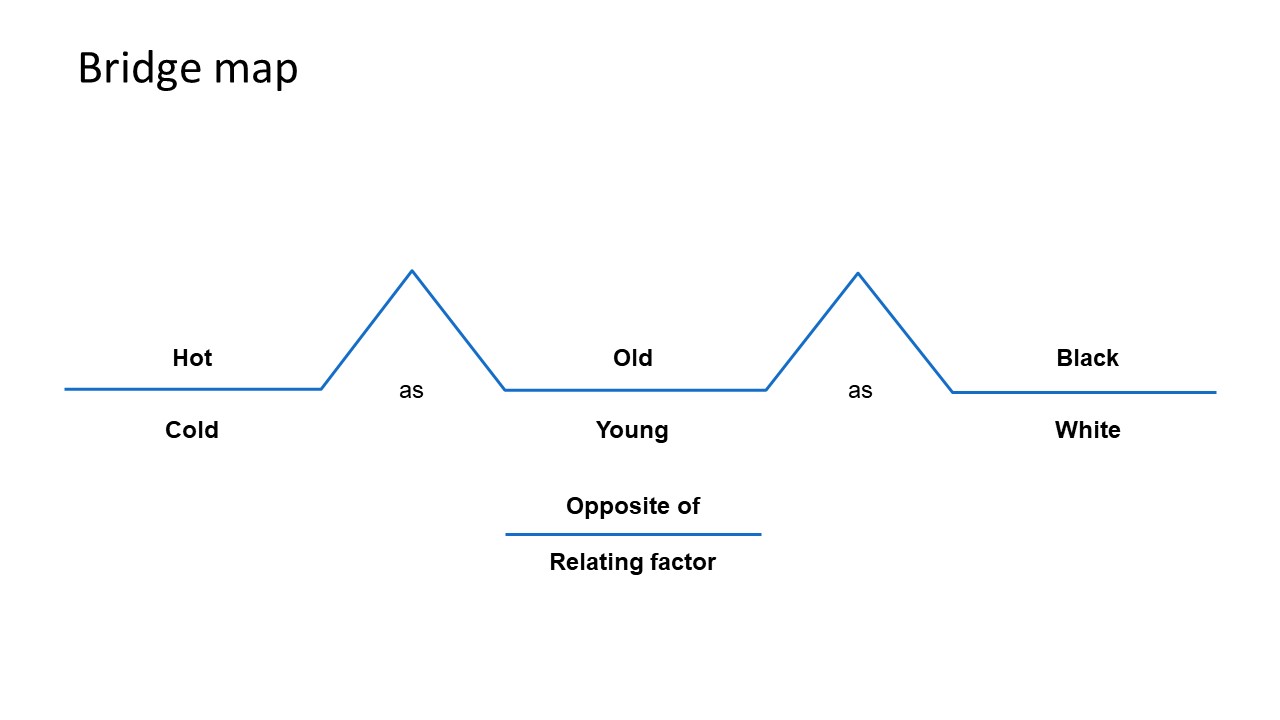
The Bridge Map PowerPoint Template is a learning tool to connect related ideas and analogies. A bridge map is designed to display an in-depth relationship between two or more topics. It helps assess analogies or metaphors on various subject matters. The relating factor must be identified between pairs. A top item relates to bottom one, same as the next pair in the bridge diagram. Just like common relationships, hot and cold, old and young, black and white. These relating factors are the “opposites of” in bridge map template.
The bridge maps are thinking maps that are useful in any learning environment. A bridge map can benefit students to create a visual pattern for analyzing complex terms or for conceptual understanding. This mapping method simplifies analogies by bridging the gap between familiar to newer, more complex pairs. Here, the straight line between two pairs represents a common relationship or relating factor. The use of thinking maps helps achieve learning targets by supporting critical thinking.
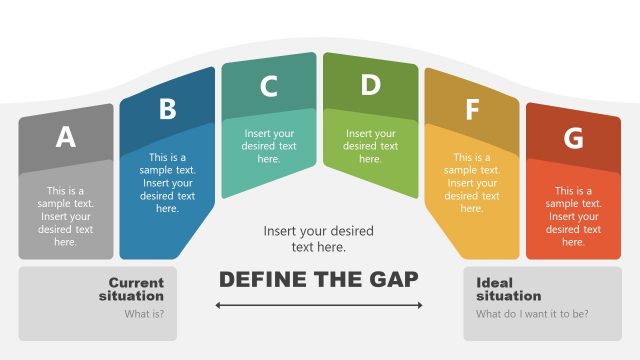
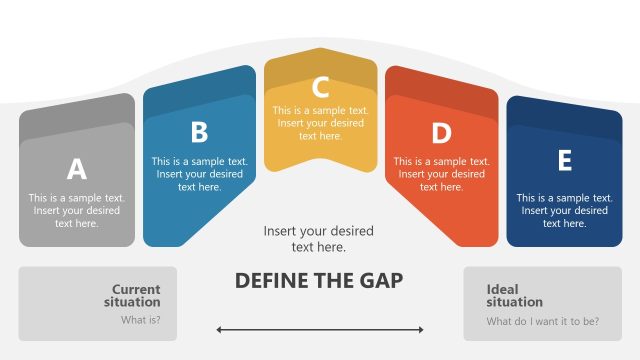
The Bridge Map PowerPoint template presents two slides for identifying relating factor. It is a simple layout of editable lines and text placeholders. This thinking map shows a simple example visualizing “opposite of” relating factor. The users can simply change text in these slides to present different relating factors and ideas in pairs.
