Break-even Analysis PowerPoint Template
Explain financial planning and pricing strategies in the executive meetings with our Break-even Analysis PowerPoint Template. Break-even is an economic calculation at which the total costs of the business service or product are equal to the total revenue made. At this point, the company has recovered its invested funds but has not yet made a profit. The break-even analysis helps professionals determine the exact volume of sales that enables the company to make a profit. This template features multiple variations of a data visualization, such as a line chart, which is helpful for organizations to present statistical data and refine their pricing plans. Stakeholders can make better investment decisions once they determine the exact break-even point. This PPT layout features five slides with a gradient grey background and a line chart overlaid on top. Some of the key attributes are:
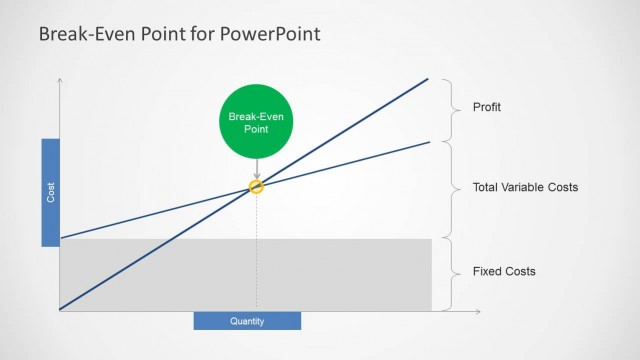
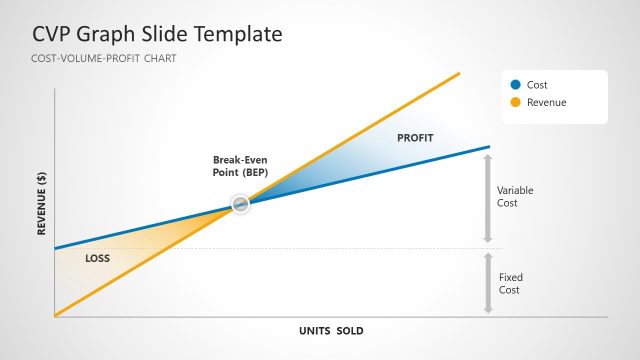
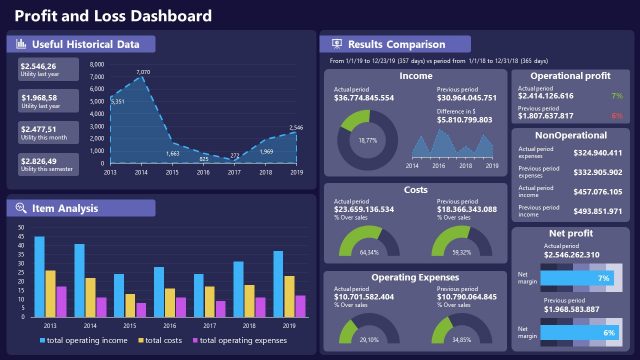
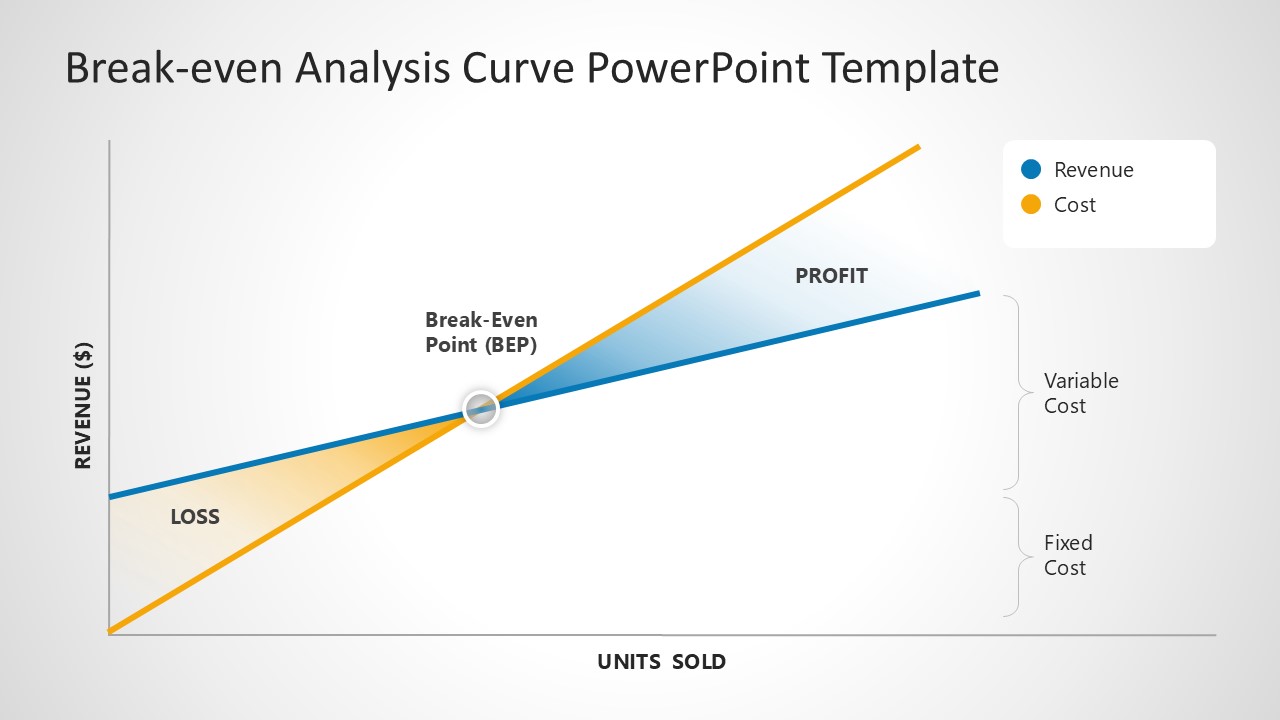
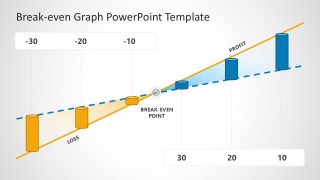
- The chart has two axes, with revenue($) on the vertical axis and units sold on the horizontal axis.
- The yellow line represents the cost, while the blue line indicates the profits.
- The shaded area before the breakpoint tells about the total loss.
- The shaded graph section after the break-even point depicts the total profit.
- Additionally, brackets are used to distinguish between fixed costs and variable costs.
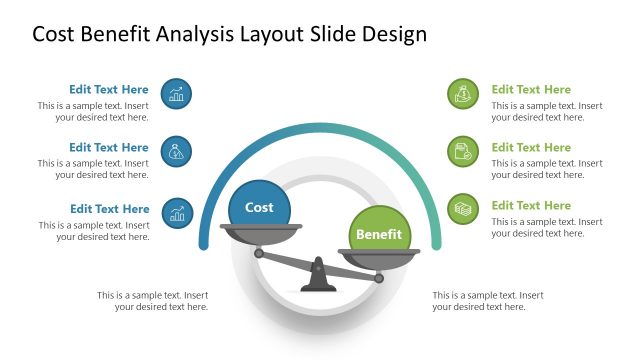
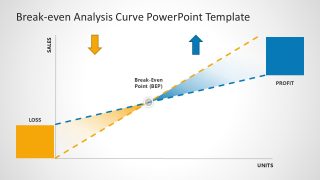
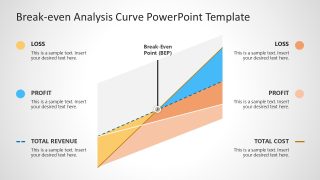
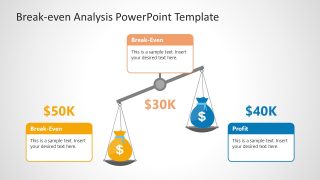
Users can also edit the Break-even Analysis PowerPoint Template with Google Slides. All five slides have the same chart, but specific changes enhance their visual impact. The second slide has blocks to showcase the magnitude of profit and loss. The third slide features a 3D effect with multiple lines, allowing for the practical discussion of individual chart components. The fourth slide has a diagram of weight balance to depict revenue and costs. In the last slide, 10, 20, or 30 numbers are used, which illustrate the depth of profit(+) or loss(-). Digital marketers, sales executives, strategy designers, and related professionals can use this template in their decision-making process to showcase a comprehensive overview of costs and benefits. Download the break-even analysis PPT template and customize it for your financial sessions!


You must be logged in to download this file.
DOWNLOAD- Category
- Data & Charts
- Rating

 Loading...
- Size
- 16x9
- Item ID
- 22854-01
- Colors
Subscribe today and get immediate
access to download our PowerPoint templates.