Slide 1 of 1 from Blur Dashboard Slide for PowerPoint
9107-blur-dashboard-template-1
Blur Dashboard Slide for PowerPoint
- Chart
- Dashboard Composite
- Financial Summary Slide
- 16:9
- 100% Editable
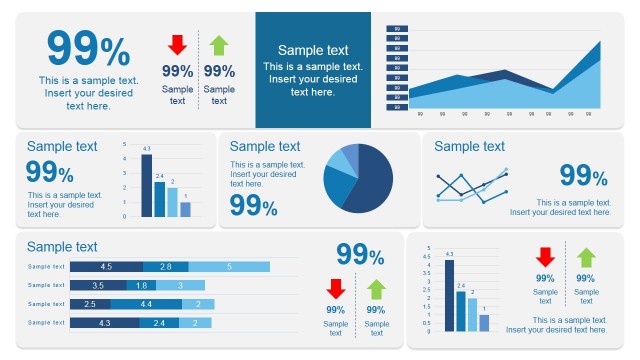
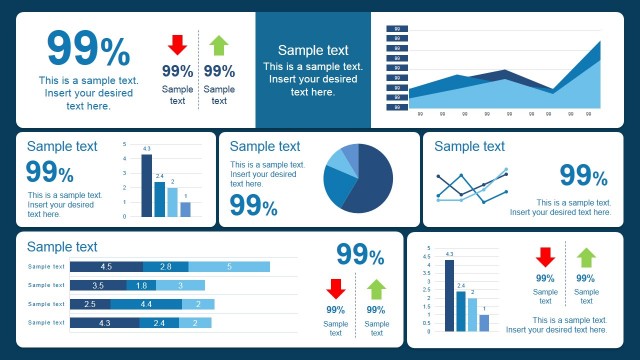
The Blur Dashboard Layout from the Blur Dashboard Slide for PowerPoint template offers a structured and visually engaging slide for financial summaries and KPI presentations. This slide template includes editable shapes and charts such as donut and bar charts, making it ideal for quarterly reviews and business presentations. Its blurred gradient background enhances focus on key metrics, supporting clear communication in corporate presentation slide decks.
What’s on This Slide
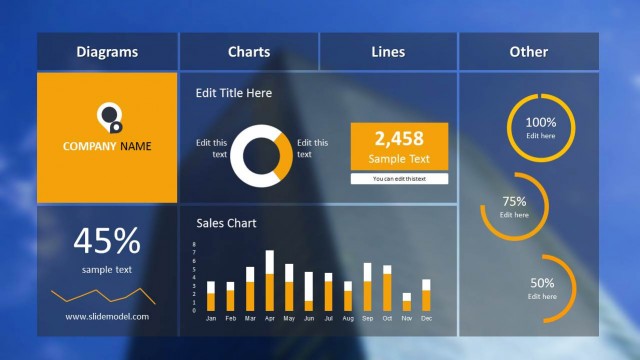
The layout features a structured dashboard with multiple sections. The top left contains a company logo placeholder, while the top right includes a title placeholder. Below, a numeric metric card displays a large number with a sample text below it. The center section features a donut chart with two editable text placeholders. The bottom section includes a bar chart labeled 'Sales Chart' with monthly data. Circular progress gauges are positioned on the right side, each with editable percentage values. The background is a blurred gradient.
How to Use It
This layout serves as a comprehensive dashboard for presenting key performance indicators and financial metrics. It is suitable for business presentations that require a visual summary of performance data. This slide fits well at the beginning of a report or as a summary slide in a financial review. It can be used in scenarios such as quarterly business reviews, sales performance updates, or KPI tracking sessions.
Text Placeholders & Capacity
Keep your copy within these limits so it fits without resizing. Body slots are tight, roughly 5-20 words each.
| Placeholder | Count | Max characters (approx.) |
|---|---|---|
| Slide title | 1 | 30 |
| Item body | 2 | 20 |
| Item body | 1 | 5 |
| Item heading | 1 | 15 |
| Chart title | 1 | 15 |
| Kpi value | 1 | 10 |
| Kpi caption | 1 | 20 |
Slide Keywords
Download unlimited PowerPoint templates, charts and graphics for your presentations with our annual plan.
DOWNLOADReturn to Blur Dashboard Slide for PowerPoint.