Slide 1 of 1 from Blur Dashboard Slide for PowerPoint with Blue Background
Blue Dashboard Slide Design for PowerPoint
Blur Dashboard Slide with KPIs and Charts
- Chart
- Dashboard Composite
- Kpi Reporting Slide
- 16:9
- 100% Editable
The Dashboard with KPIs and Charts slide from the Blur Dashboard Slide for PowerPoint with Blue Background template offers a structured layout ideal for business presentations focused on performance tracking and strategic planning. This slide includes editable shapes and vector icons to clearly display key metrics and sales data, making it a practical choice for corporate presentation slide decks and quarterly review meetings.
About This Slide
Featured on this Office template is a blue dashboard slide design for PowerPoint which may be used to present a company profile for purposes of a marketing or business presentation, or to be used in making business decisions, such as hostile takeovers or corporate investments.
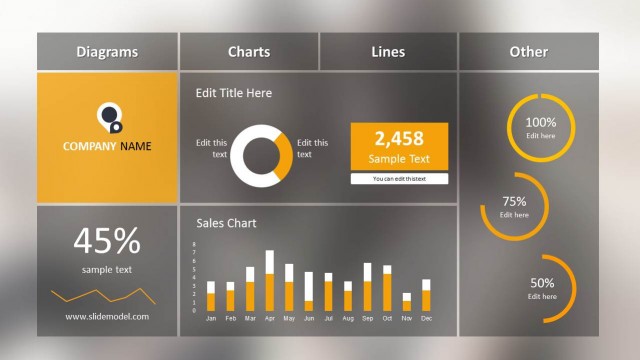
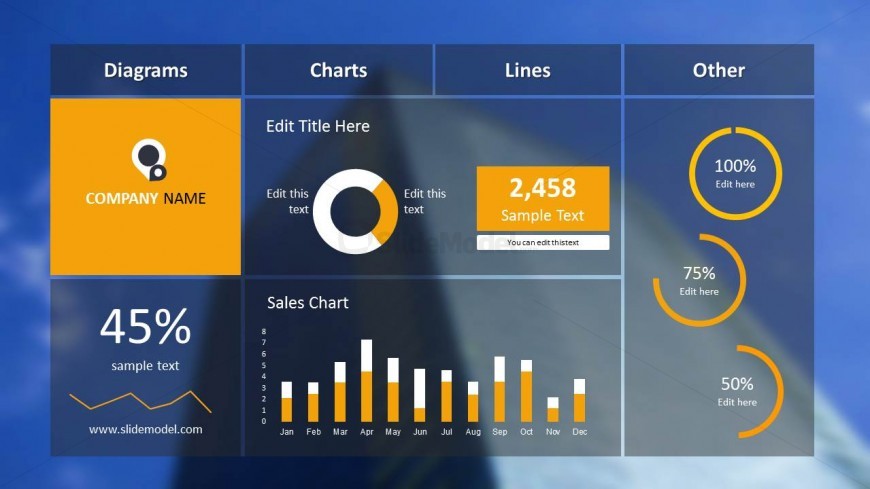
The PowerPoint slide contains five key components, containing a highlighted text box which may be inserted with the company name; a box containing a percentage and a line graph, which may be used to show overall company growth; a donut diagram and a text box containing a number, which may be used to show the company’s share in customer market share and rates of production; a bar char which may be used to show monthly sales reports; and a set of percentage diagram which may be used to present different stages of completion. The presentation background features a corporate building, which is blurred to give emphasis to the PowerPoint slide. All PowerPoint objects are 100% editable to fit the presenter’s needs and preferences.
What’s on This Slide
The slide features a structured layout with multiple sections. The top left contains a logo placeholder labeled 'COMPANY NAME.' Adjacent to it is a title placeholder. Below, a KPI indicator displays '45%' with sample text. The center section includes a bar chart labeled 'Sales Chart' with monthly data represented in orange and white bars. To the right, there are three circular KPI indicators showing percentages of '100%', '75%', and '50%.' Each section is visually separated with a blue background and clear boundaries, creating a cohesive design.
How to Use It
This layout serves as a dashboard for presenting key performance indicators and sales data. It is suitable for business management presentations, allowing users to display metrics and charts effectively. The slide can be used in various contexts, such as quarterly reviews, performance tracking, or strategic planning sessions. It fits well at the beginning of a presentation to set the stage for detailed discussions on performance metrics and business insights.
Text Placeholders & Capacity
Keep your copy within these limits so it fits without resizing. Body slots are tight, roughly 10 words each.
| Placeholder | Count | Max characters (approx.) |
|---|---|---|
| Slide title | 1 | 30 |
| Item heading | 1 | 10 |
| Item body | 1 | 10 |
| Item body | 1 | 10 |
| Item body | 1 | 10 |
| Body paragraph | 1 | 50 |
| Body paragraph | 1 | 50 |
Slide Keywords
Download unlimited PowerPoint templates, charts and graphics for your presentations with our annual plan.
DOWNLOADReturn to Blur Dashboard Slide for PowerPoint with Blue Background.