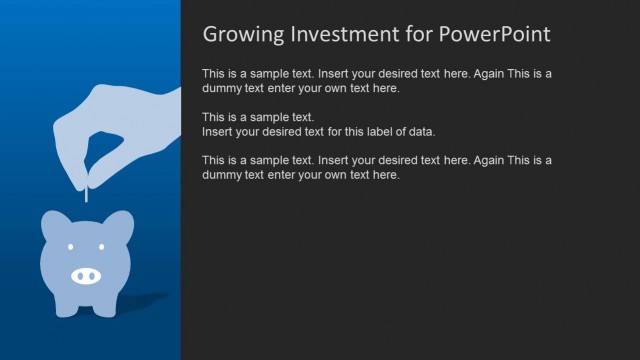
Slide 6 of 14 from Blue Growth Investment PowerPoint Template
Three Columns PowerPoint Piggy Bank Chart
Growing Investment Comparison Slide
- Diagram
- Comparison Split
- Financial Summary Slide
- 16:9
- 100% Editable
The Growing Investment Comparison slide from the Blue Growth Investment PowerPoint Template uses clear, editable shapes and vector icons to visually compare different investment amounts. This slide layout supports financial summaries in business presentations and pitch decks, helping to illustrate savings strategies and investment growth effectively within professional slide templates.
What’s on This Slide
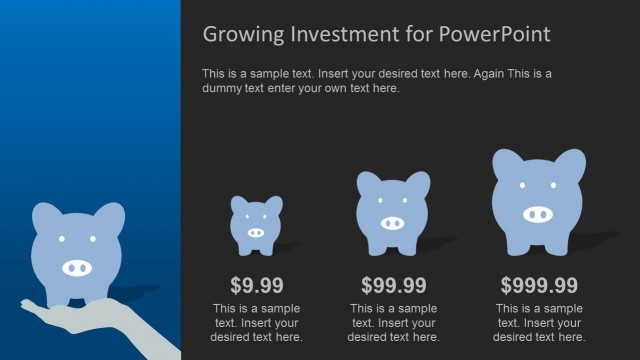
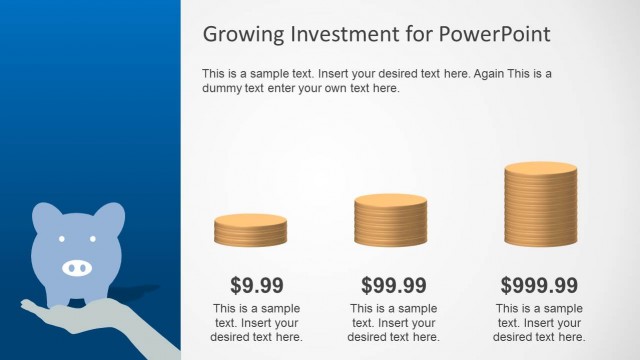
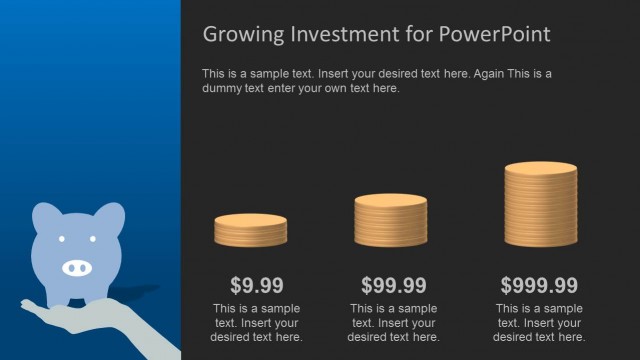
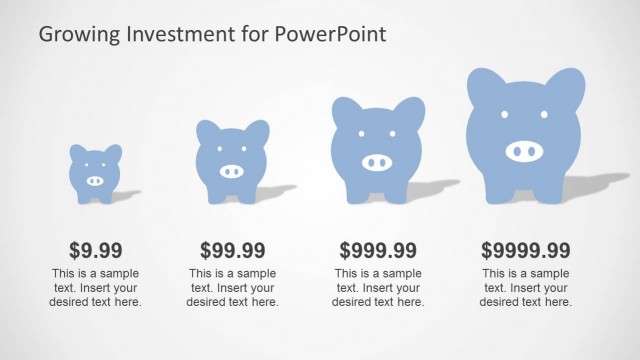
The layout features three piggy bank icons arranged horizontally across the slide. Each piggy bank is a different size, representing varying amounts of money: $9.99, $99.99, and $999.99. Below each icon, there are text placeholders for descriptions aligned centrally. The background transitions from a deep blue on the left to a lighter gradient on the right, enhancing visual contrast. The icons are simple and cartoonish, emphasizing a playful theme. The overall composition is balanced, with a clear visual hierarchy established by the size of the piggy banks and the text alignment.
How to Use It
This layout serves as a comparative analysis of investment amounts, ideal for illustrating growth in savings or investments. It fits well after a problem slide that discusses financial challenges, leading into a roadmap for financial planning. This structure is useful in business presentations to showcase different investment tiers or savings goals, making it applicable in financial education, investment pitches, or savings strategy discussions.
Text Placeholders & Capacity
Keep your copy within these limits so it fits without resizing. Node body slots can accommodate about 10-12 words each.
| Placeholder | Count | Max characters (approx.) |
|---|---|---|
| Item heading | 3 | 10 |
| Item body | 3 | 60 |
| Slide title | 1 | 40 |
Slide Keywords
Download unlimited PowerPoint templates, charts and graphics for your presentations with our annual plan.
DOWNLOADReturn to Blue Growth Investment PowerPoint Template.