Slide 13 of 14 from Blue Growth Investment PowerPoint Template
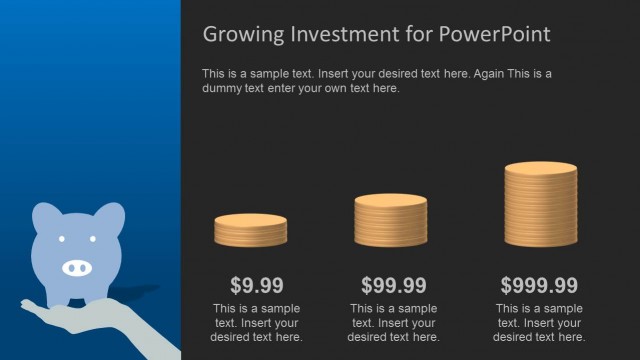
Black Background Piggy Bank Chart for PowerPoint
Investment Growth Comparison Slide
- Diagram
- Comparison Split
- Comparison Slide
- 16:9
- 100% Editable
What’s on This Slide
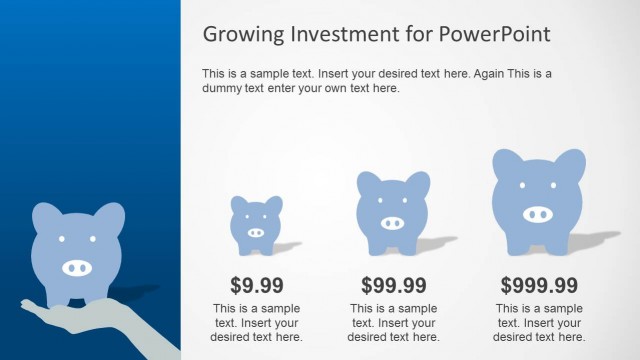
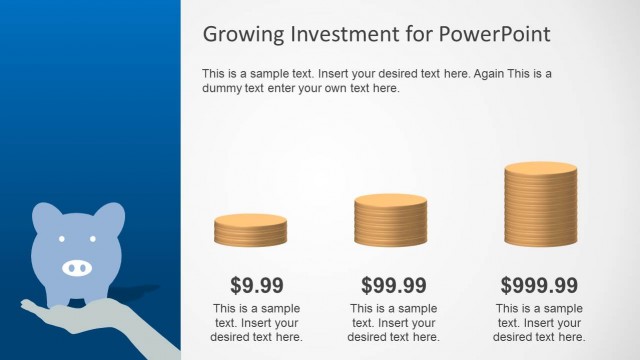
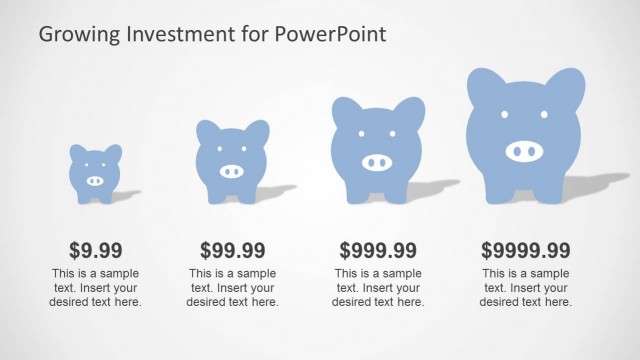
The slide features a dark background with a gradient transitioning from blue to black. On the left, a hand icon supports a small piggy bank, while three piggy banks are aligned horizontally on the right. Each piggy bank is a different size, representing varying amounts: $9.99, $99.99, and $999.99. Below each piggy bank, there are text placeholders aligned center, indicating space for descriptions. The visual hierarchy emphasizes the largest piggy bank, with smaller ones below it. The overall composition groups the piggy banks and text together, creating a clear visual structure.
How to Use It
This layout serves as a comparison tool for illustrating investment growth. It fits well in a presentation sequence after discussing savings strategies and before outlining specific investment options. It is suitable for financial presentations, investment pitches, or educational contexts where illustrating growth potential is necessary. The slide can effectively communicate the concept of incremental investment returns, making it relevant for discussions on savings and financial planning.
Text Placeholders & Capacity
Keep your copy within these limits so it fits without resizing. Node body slots can hold about 10 words each.
| Placeholder | Count | Max characters (approx.) |
|---|---|---|
| Item heading | 3 | 10 |
| Item body | 3 | 50 |
| Slide title | 1 | 50 |
Slide Keywords
Download unlimited PowerPoint templates, charts and graphics for your presentations with our annual plan.
DOWNLOADReturn to Blue Growth Investment PowerPoint Template.