Slide 10 of 15 from Blue Company Profile Business PowerPoint Template
6085-03-blue-company-profile-10
Line Chart for Data Visualization
- Chart
- Line Chart
- Evaluation Slide
- 16:9
- 100% Editable
The Line Chart slide from the Blue Company Profile Business PowerPoint Template offers a clear visualization of sales trends and market growth using editable shapes and vector icons. Designed for corporate presentations, this slide template effectively communicates performance metrics over time, making it a valuable component of any business presentation or pitch deck template.
What’s on This Slide
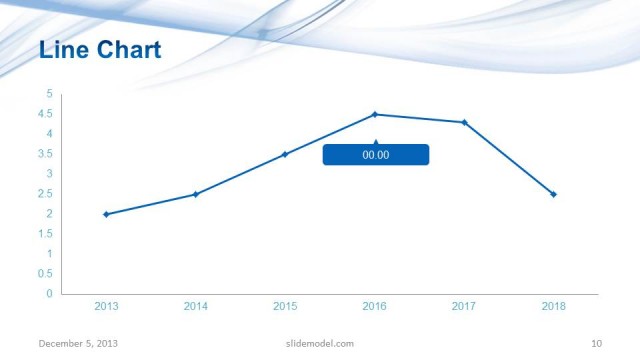
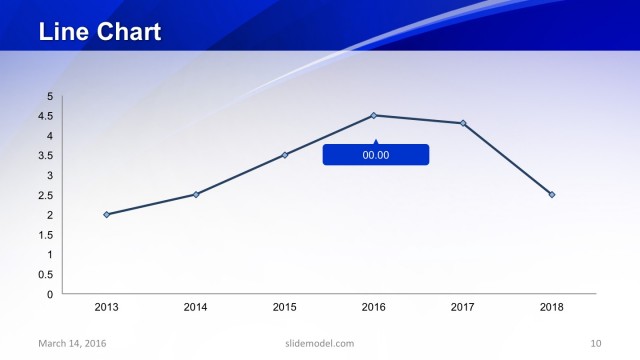
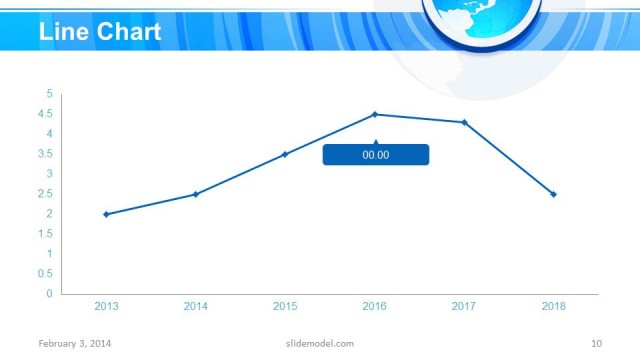
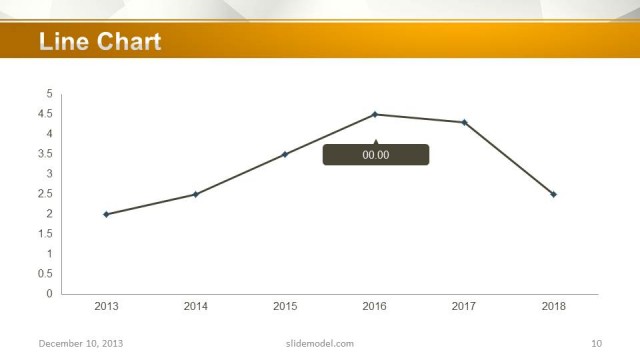
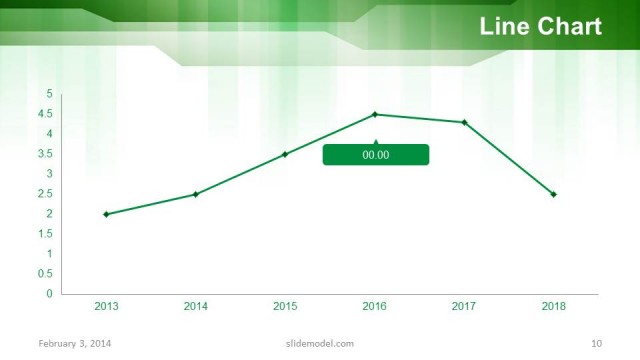
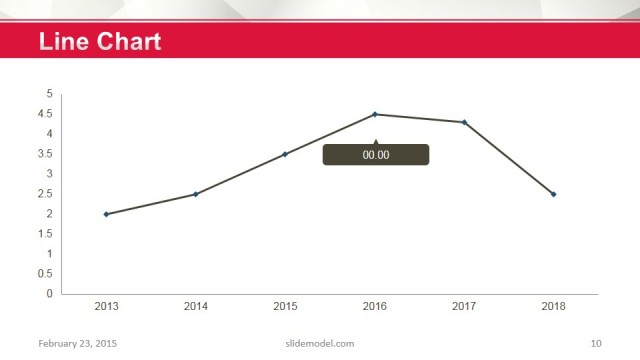
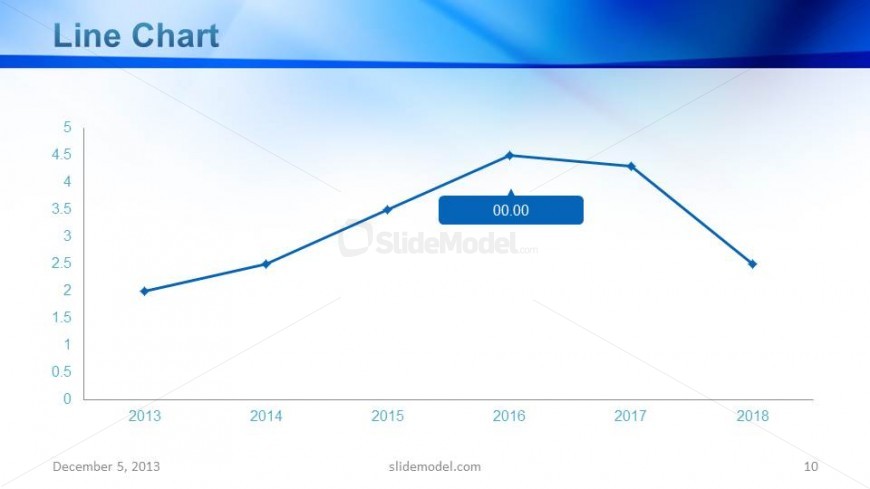
The slide features a line chart positioned centrally, depicting data trends over several years from 2013 to 2018. The vertical axis ranges from 0 to 5, while the horizontal axis displays the years. Data points are marked with diamond shapes, connected by a smooth line. A highlighted data point shows a value of '00.00' within a rectangular box. The title 'Line Chart' is placed at the top left, and a date footer is located at the bottom left. The background has a gradient blue color scheme, enhancing visual appeal.
How to Use It
This layout serves as a data visualization tool, ideal for illustrating trends over time in a business context. It fits well in a presentation sequence after problem identification and before strategic recommendations. Scenarios include showcasing sales growth, market trends, or performance metrics. This slide is effective for stakeholders needing to understand data-driven insights quickly and clearly.
Text Placeholders & Capacity
Keep your copy within these limits so it fits without resizing. Chart title and footer slots are tight, roughly 10 and 25 characters respectively.
| Placeholder | Count | Max characters (approx.) |
|---|---|---|
| Chart title | 1 | 10 |
| Footer | 1 | 25 |
Slide Keywords
Download unlimited PowerPoint templates, charts and graphics for your presentations with our annual plan.
DOWNLOADReturn to Blue Company Profile Business PowerPoint Template.