Slide 10 of 15 from Blue Circle Professional PowerPoint Template
10011-blue-circle-slidemodel-template-0001-10
Line Chart for Data Visualization
- Chart
- Line Chart
- Evaluation Slide
- 16:9
- 100% Editable
The Line Chart slide from the Blue Circle Professional PowerPoint Template offers a clear way to visualize data trends and performance metrics over time. This slide layout is ideal for business presentations that require illustrating growth or sales performance with editable shapes and vector icons enhancing clarity. Its design supports effective communication of key metrics in corporate presentations and pitch deck templates.
What’s on This Slide
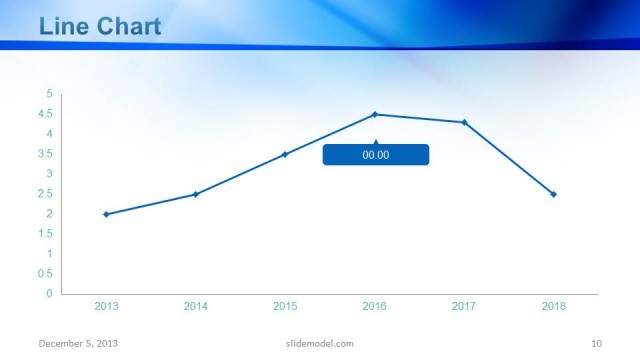
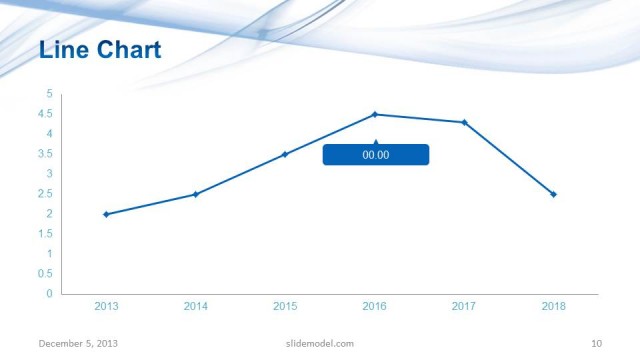
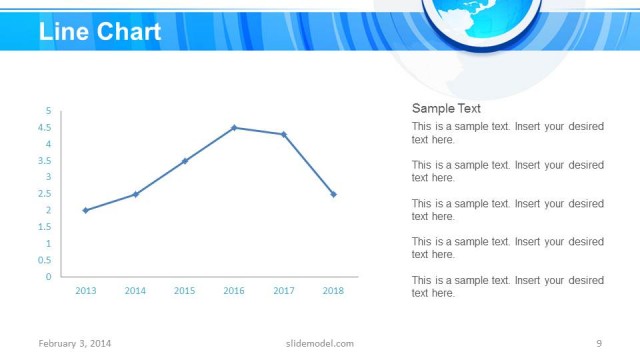
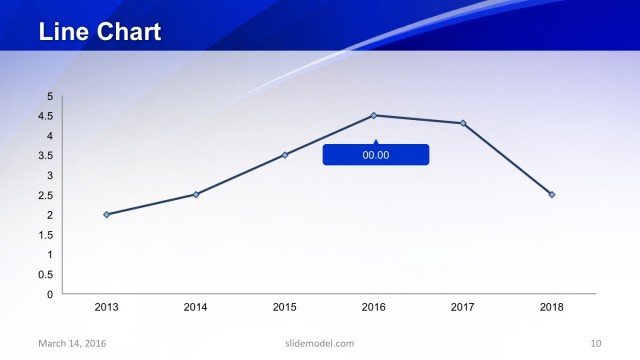
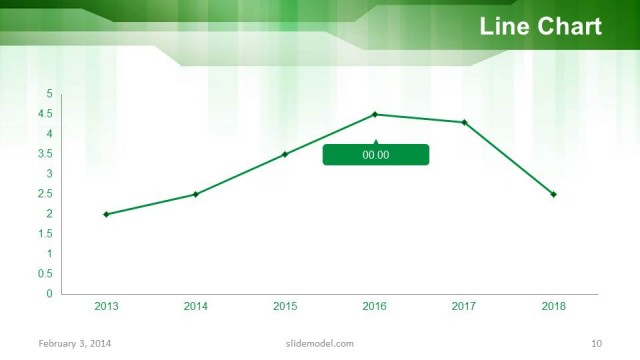
The slide features a line chart positioned centrally, displaying data trends over several years from 2013 to 2018. The vertical axis is labeled with values ranging from 0 to 5, while the horizontal axis indicates the years. Data points are marked with diamond shapes, connected by a smooth line. A highlighted data point shows a value of '00.00' in a rectangular box. The background includes a circular globe graphic at the top right, with a blue gradient and striped design enhancing the overall layout. Text placeholders exist for the title and footer.
How to Use It
This layout serves as a data visualization tool, ideal for presenting trends or performance metrics over time. It fits well in a business presentation sequence, particularly after problem identification or analysis slides. This slide is useful for illustrating growth, sales performance, or project timelines, allowing audiences to quickly grasp changes in data. It is suitable for corporate settings where data-driven decisions are discussed, providing a clear visual representation of key metrics.
Text Placeholders & Capacity
Keep your copy within these limits so it fits without resizing. Title and footer slots are tight, roughly 5-10 words each.
| Placeholder | Count | Max characters (approx.) |
|---|---|---|
| Chart title | 1 | 20 |
| Footer | 1 | 30 |
Slide Keywords
Download unlimited PowerPoint templates, charts and graphics for your presentations with our annual plan.
DOWNLOADReturn to Blue Circle Professional PowerPoint Template.