Slide 10 of 15 from Green Stripes Business PowerPoint Template
10015-green-stripes-slidemodel-template-0001-10
Line Chart for Business Analysis
- Chart
- Line Chart
- Evaluation Slide
- 16:9
- 100% Editable
What’s on This Slide
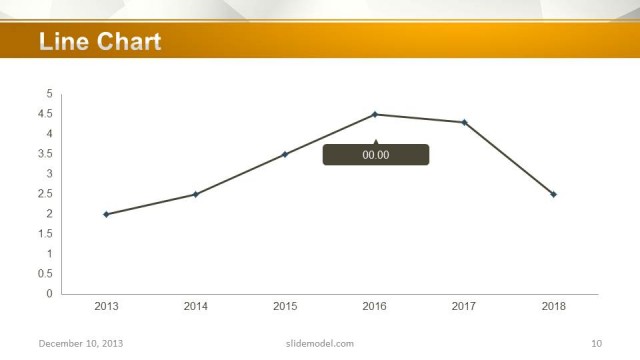
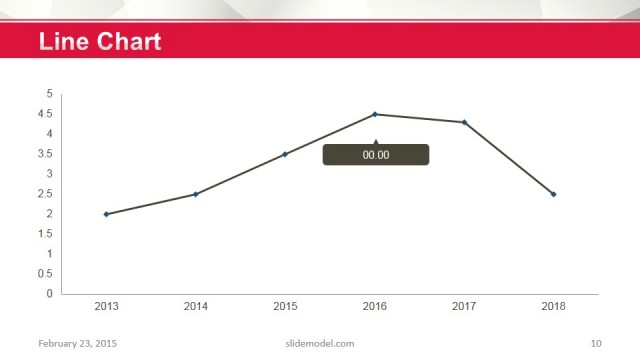
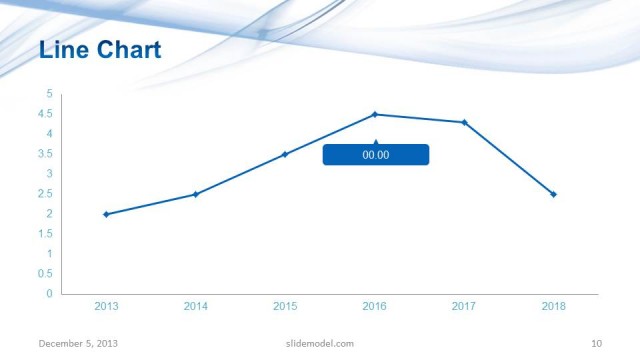
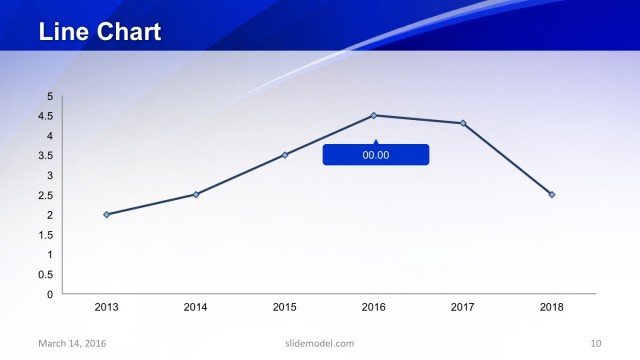
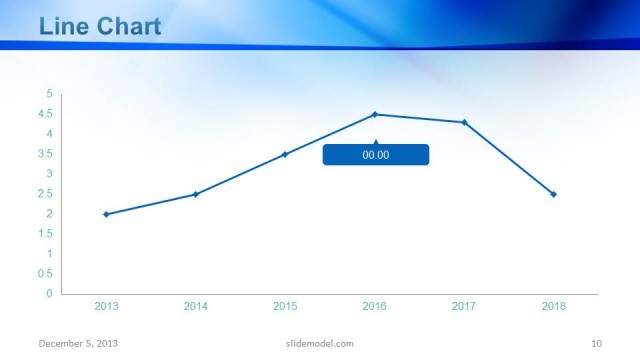
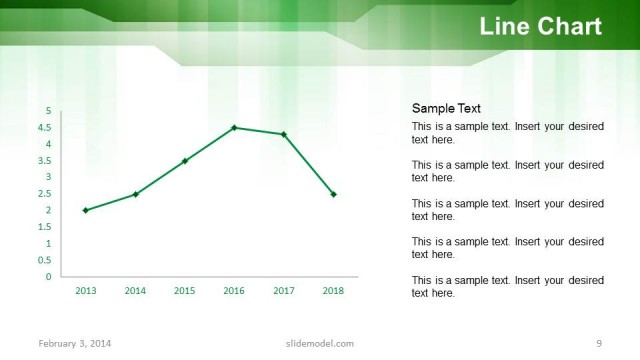
The slide features a line chart positioned centrally, displaying data trends over the years 2013 to 2018. The vertical axis ranges from 0 to 5, while the horizontal axis marks the years. Data points are represented by diamond shapes connected by a green line, indicating changes in values. A green callout box labeled '00.00' highlights a specific data point on the chart. The background includes a gradient of green stripes, enhancing visual appeal without distracting from the chart. Text placeholders are present for the title and footer, aligned at the top and bottom, respectively.
How to Use It
This layout serves as a data visualization tool, ideal for presenting trends over time in business contexts. It fits well in a presentation sequence following problem identification slides, providing a visual representation of data analysis. Common scenarios include financial performance reviews, sales trend analysis, or project progress tracking. The chart can effectively communicate quantitative changes, making it suitable for stakeholders needing clear data insights.
Text Placeholders & Capacity
Keep your copy within these limits so it fits without resizing. Chart title and footer slots are tight, roughly 5-10 words each.
| Placeholder | Count | Max characters (approx.) |
|---|---|---|
| Chart title | 1 | 30 |
| Footer | 1 | 50 |
Slide Keywords
Download unlimited PowerPoint templates, charts and graphics for your presentations with our annual plan.
DOWNLOADReturn to Green Stripes Business PowerPoint Template.