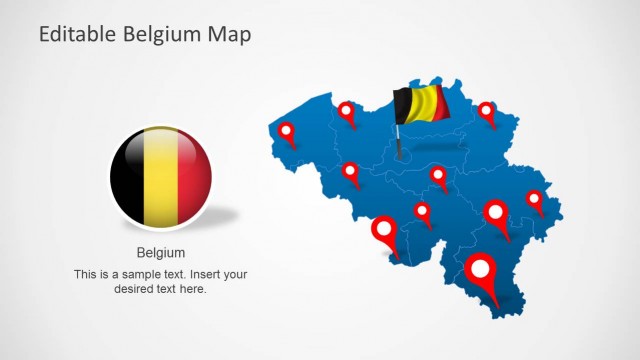
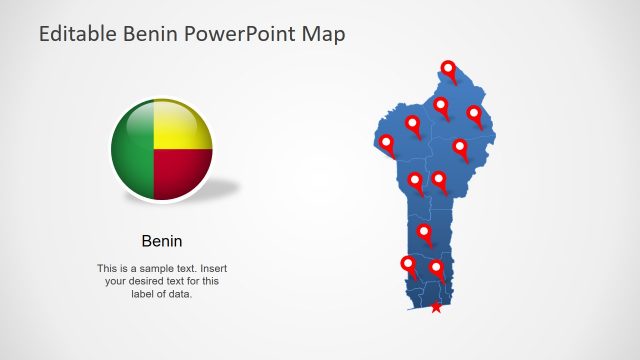
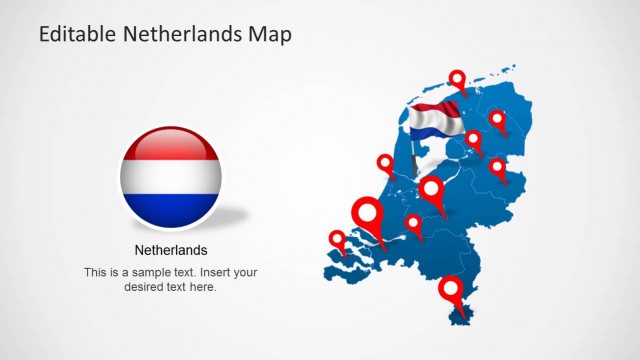
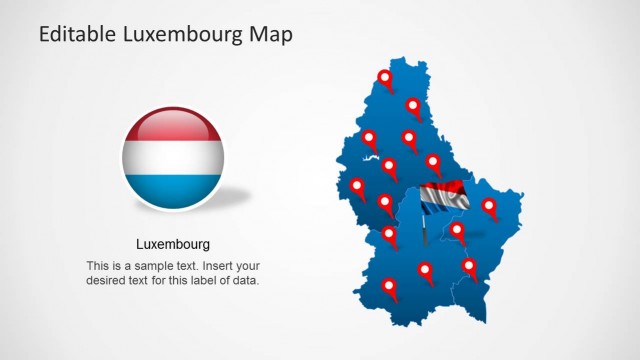
Benelux Political Region PowerPoint Map
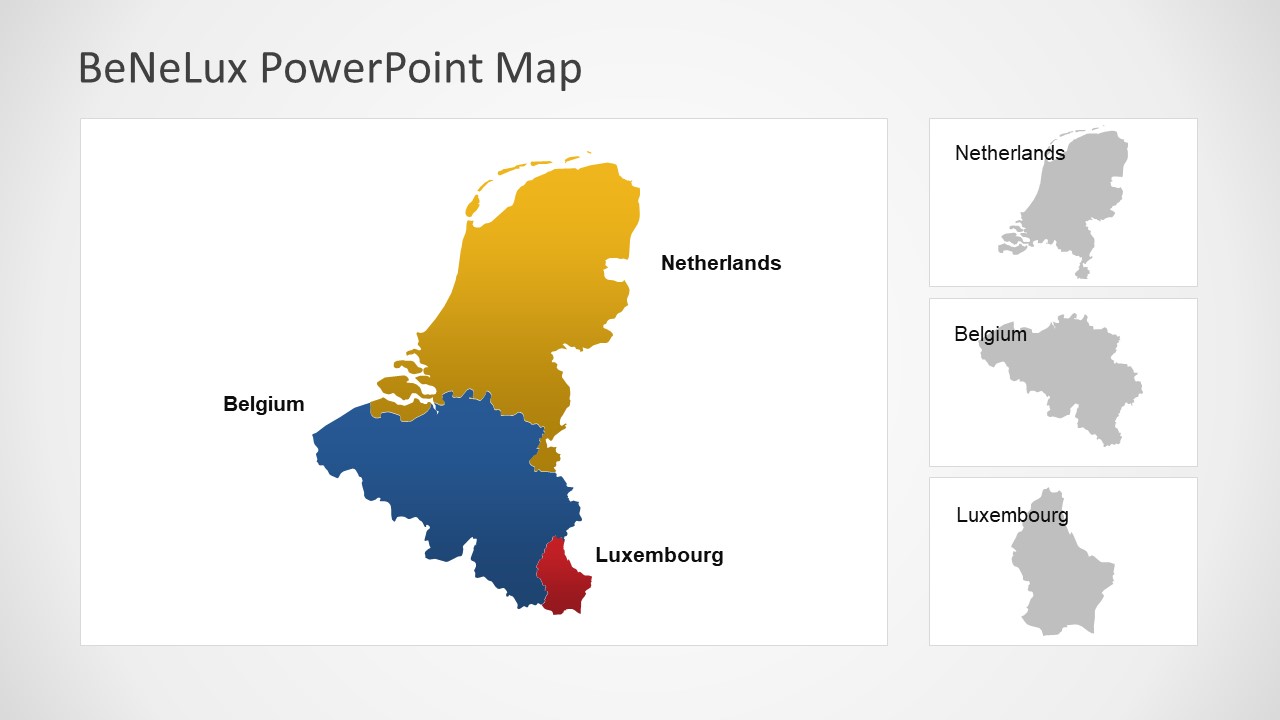
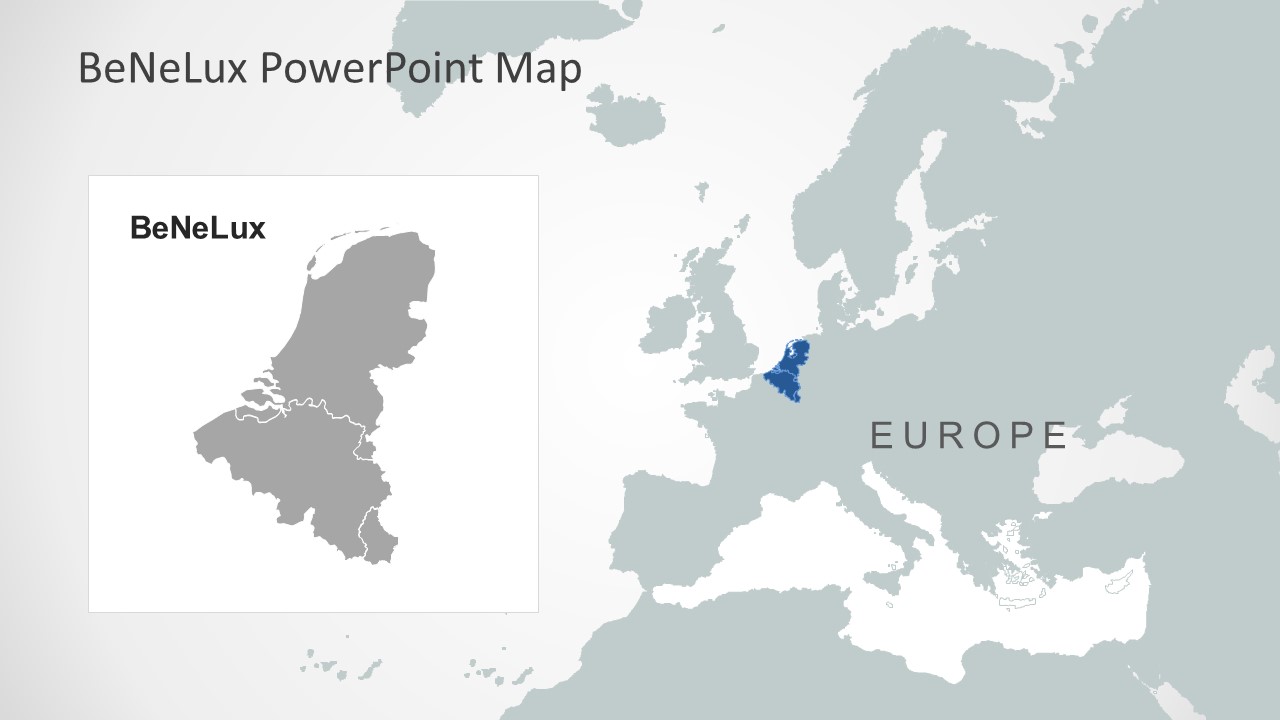
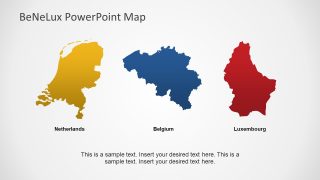
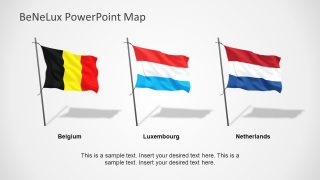
The Benelux Political Region PowerPoint Map is a geographical presentation of three powerful nations of the world. Benelux is a political-economic union of three neighboring countries, Belgium, Netherland and Luxembourg. The word Be-Ne-Lux comprising of first two or three letters of each country’s name. This PowerPoint map is perfect for visualization of business territories or company reporting. The Benelux is the union of prosperous nations having opportunities for potential business. It is suitable to display business, sales and marketing reports concerning the Benelux region. The PowerPoint template also contain data driven slides which are usable for multiple statistical surveys. The users of any industry or domain associated with these regions can use this deck for variety of topics. The range of maps aids in depicting crucial information to the audience in an attractive manner.
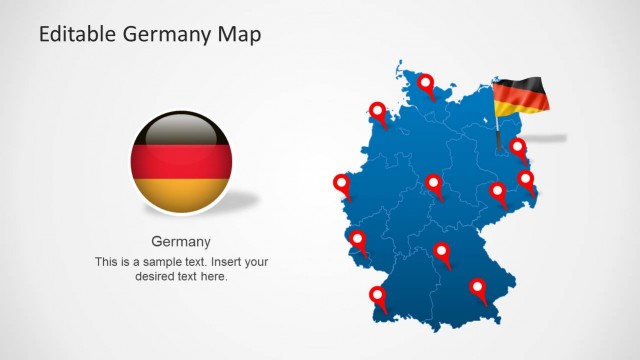
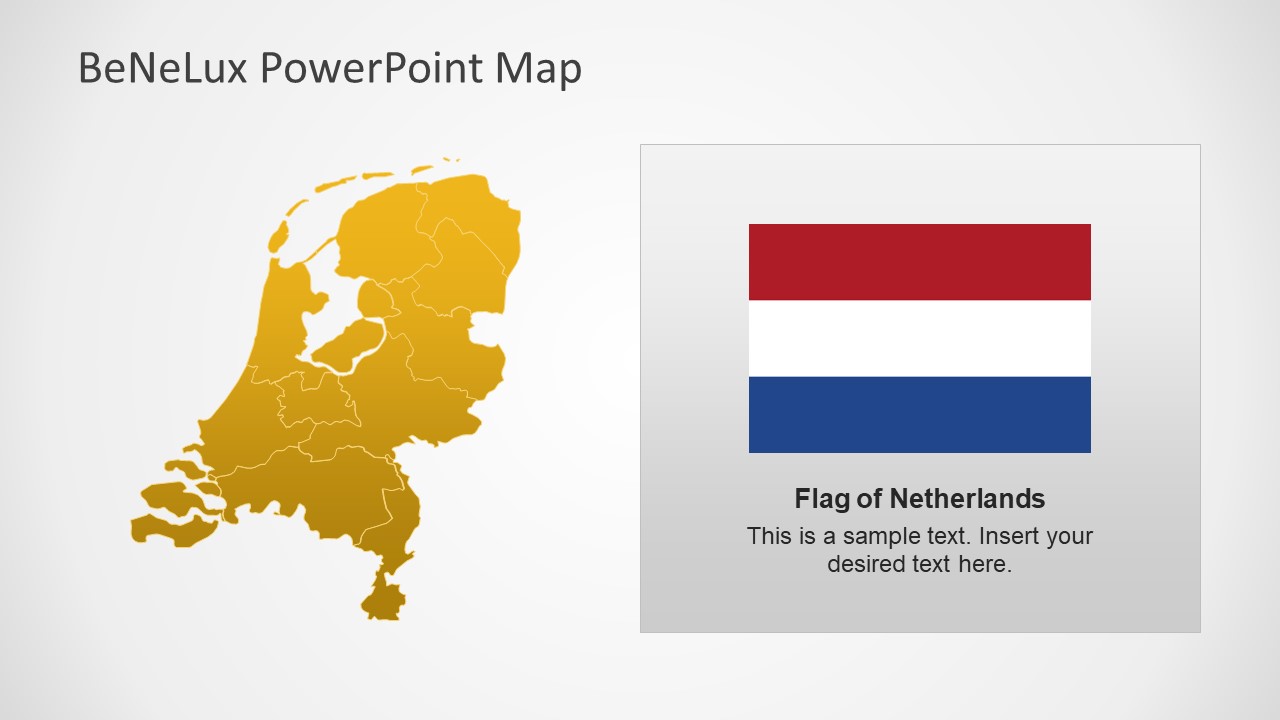
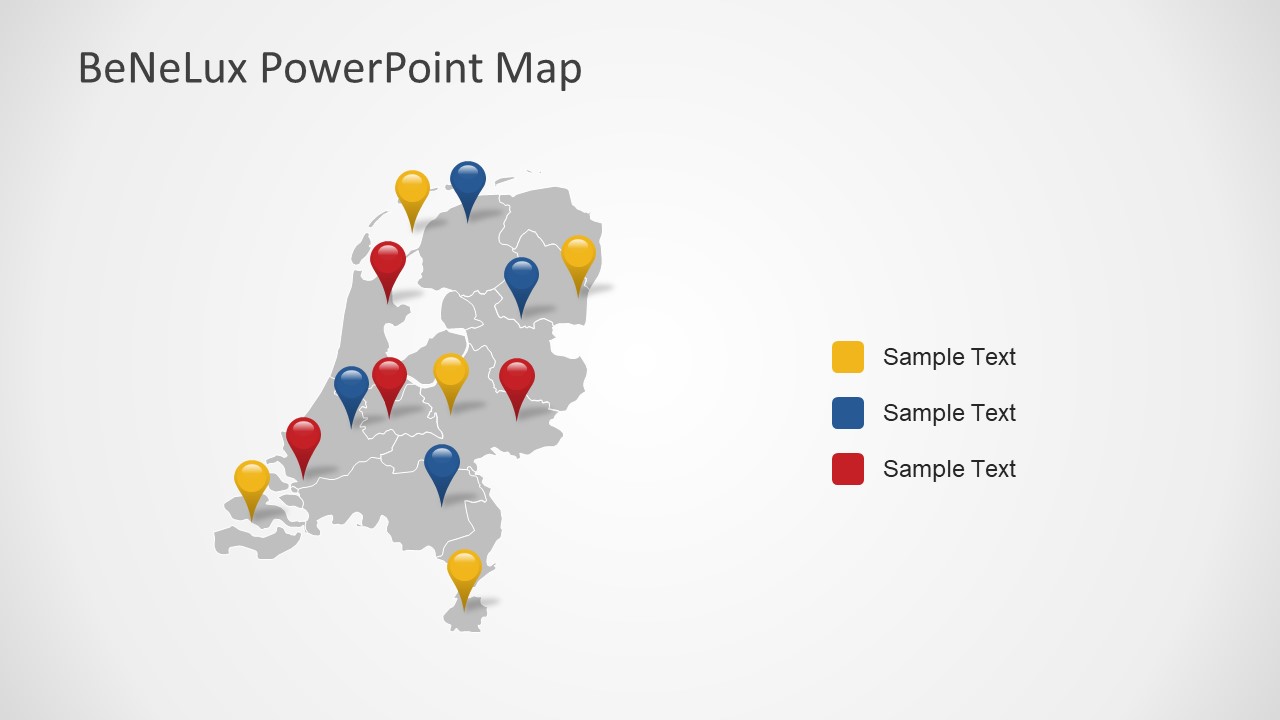
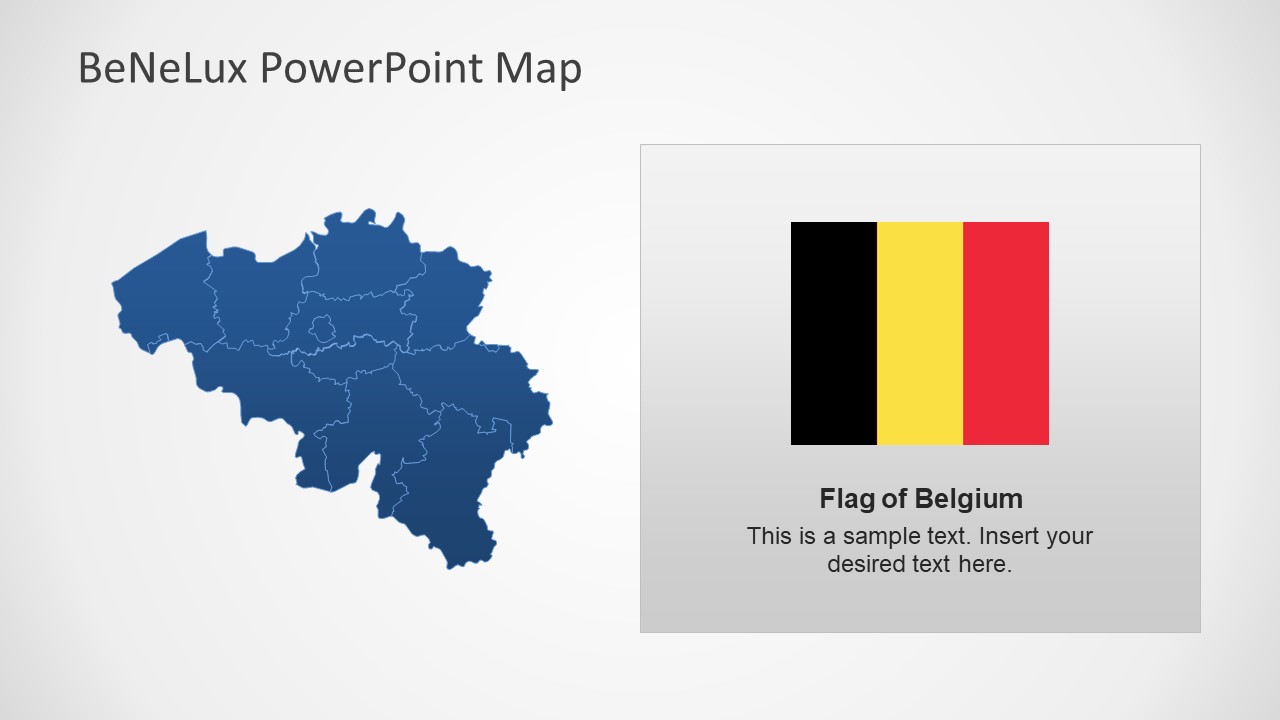
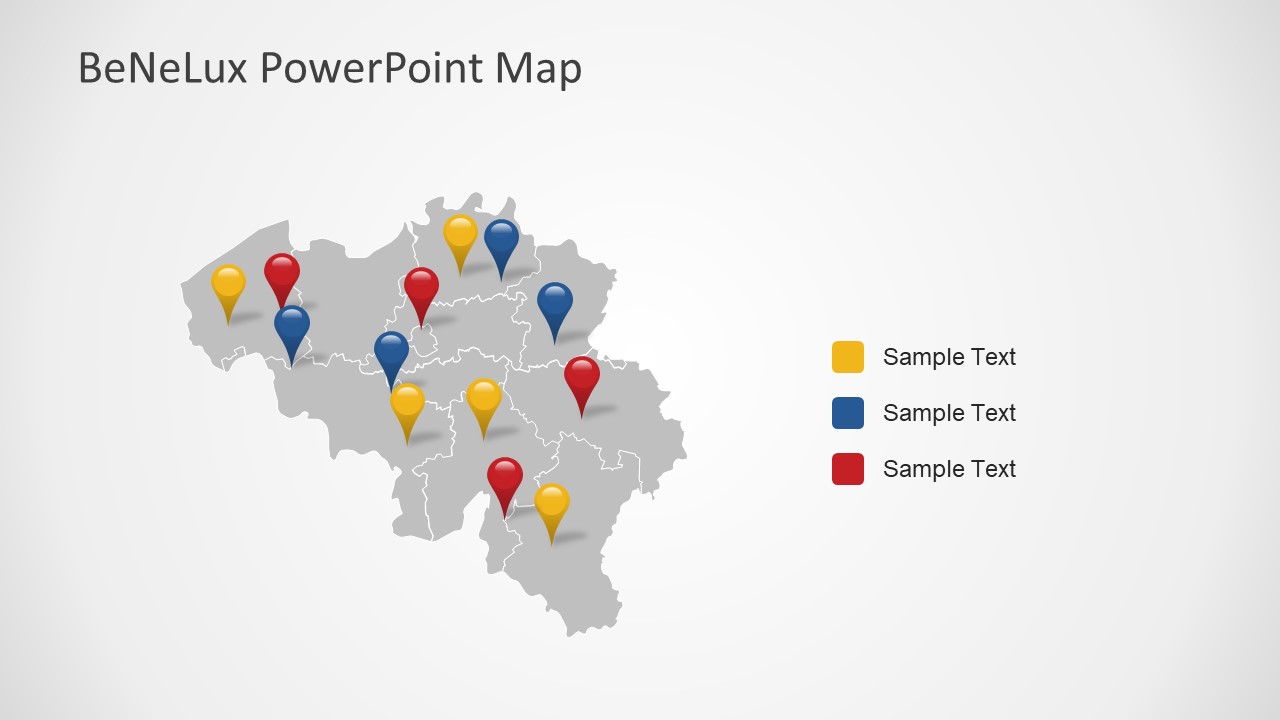
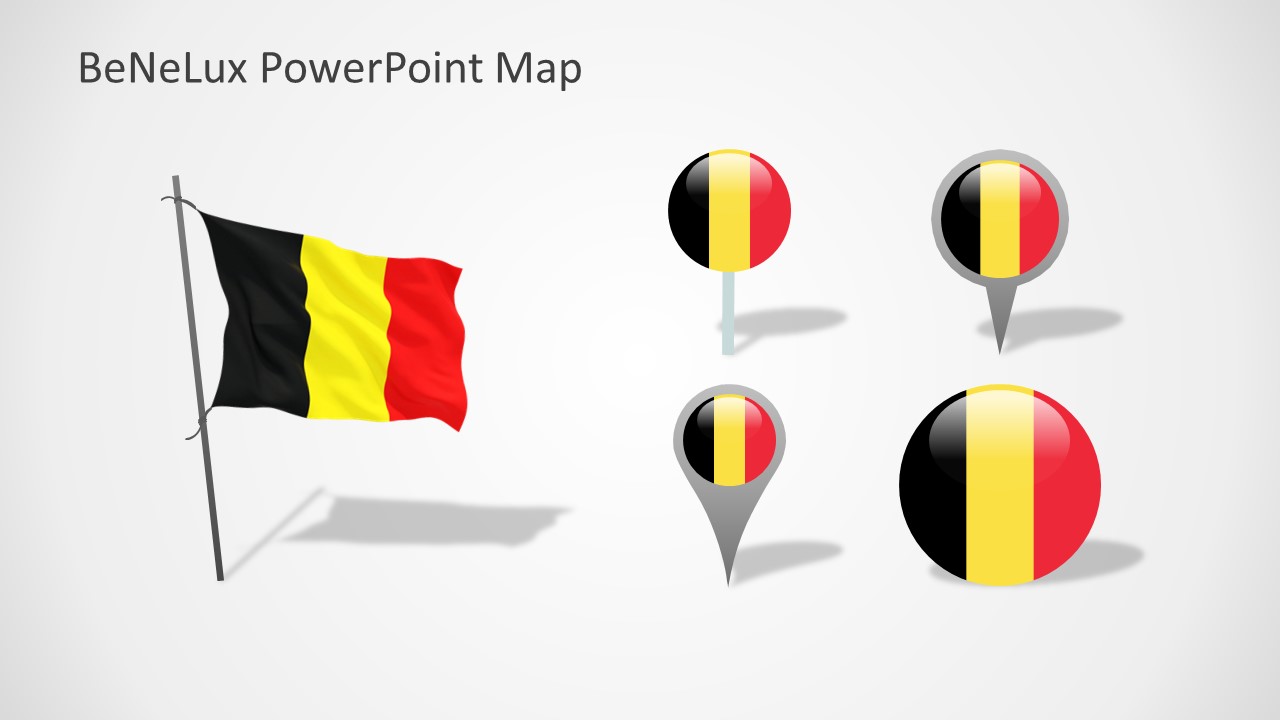
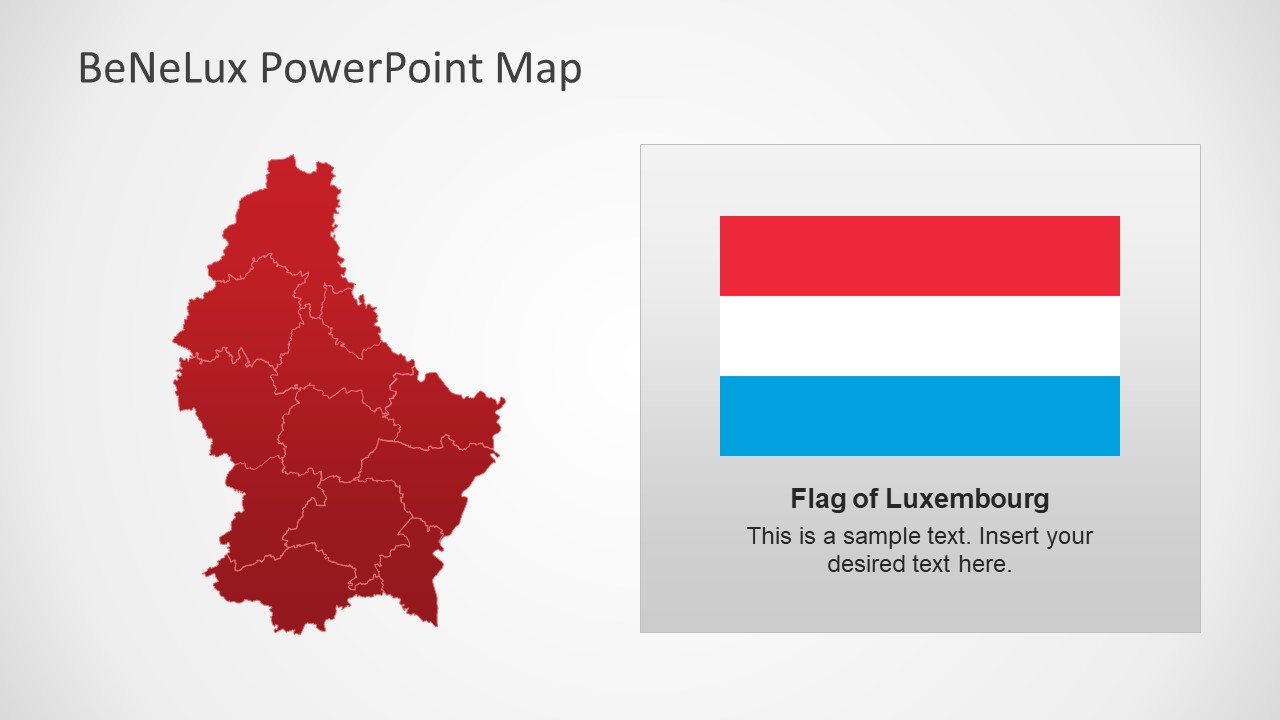
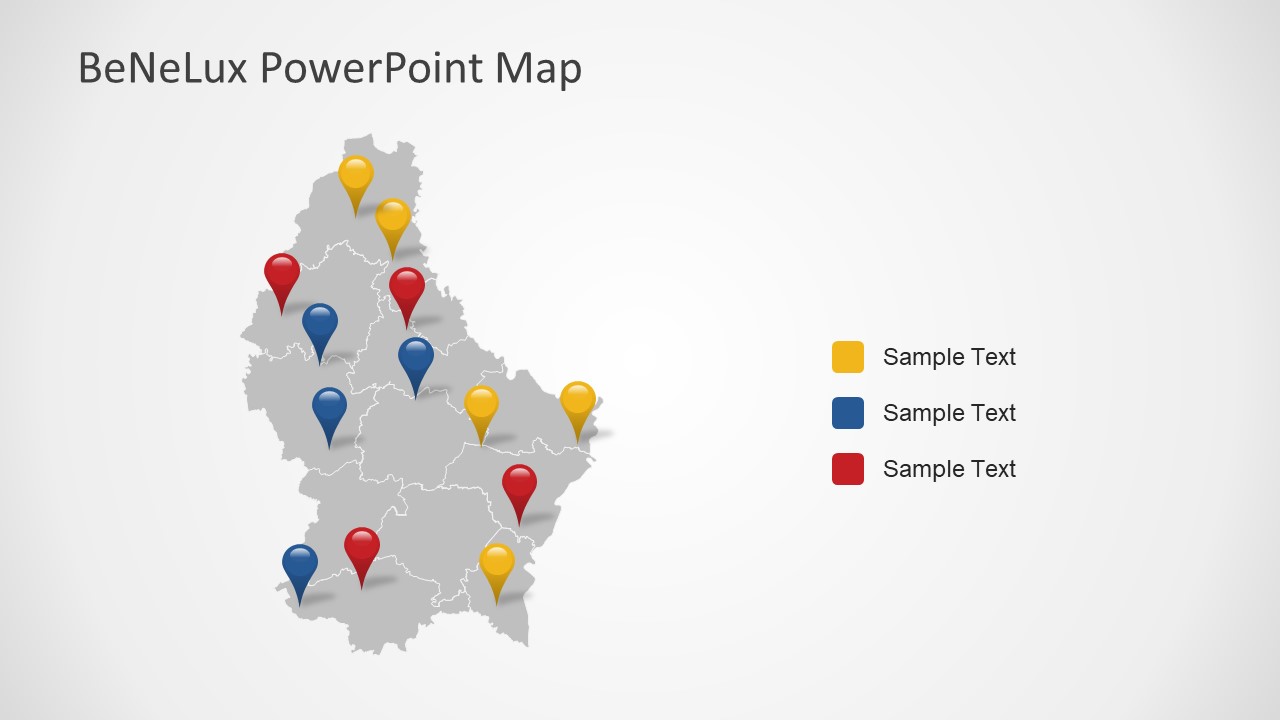
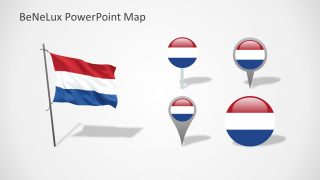
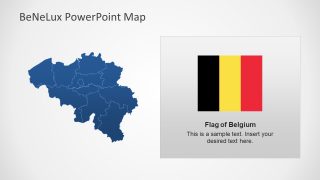
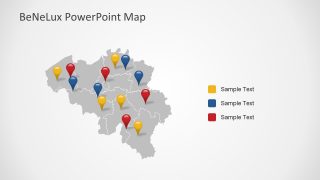
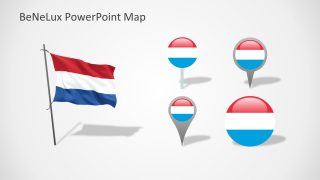
The 16-slide set of Benelux Political Region PowerPoint Map presents locations, regional boundaries, flags and charts. There are three different country maps designs available in this presentation template. Although, there are different flag in the template, such as, flag on pole, flat rectangular and location markers. However, there are 4 distinct style of location markers for each flag as PowerPoint Icons. The images of outline provinces are the collection of PowerPoint shapes join together to create a map.
The Benelux Political Region PowerPoint Map are editable maps, and users can make changes in given figures. For instance, highlight a capital of state by changing the color or add a location pin over it. To change the color, select a shape, in a format menu, choose from solid fill color pallet. On the other hand, to add a pin pointer, choose a desire pin from four samples. After that, copy and paste and adjust according by resizing and dragging to accurate location.
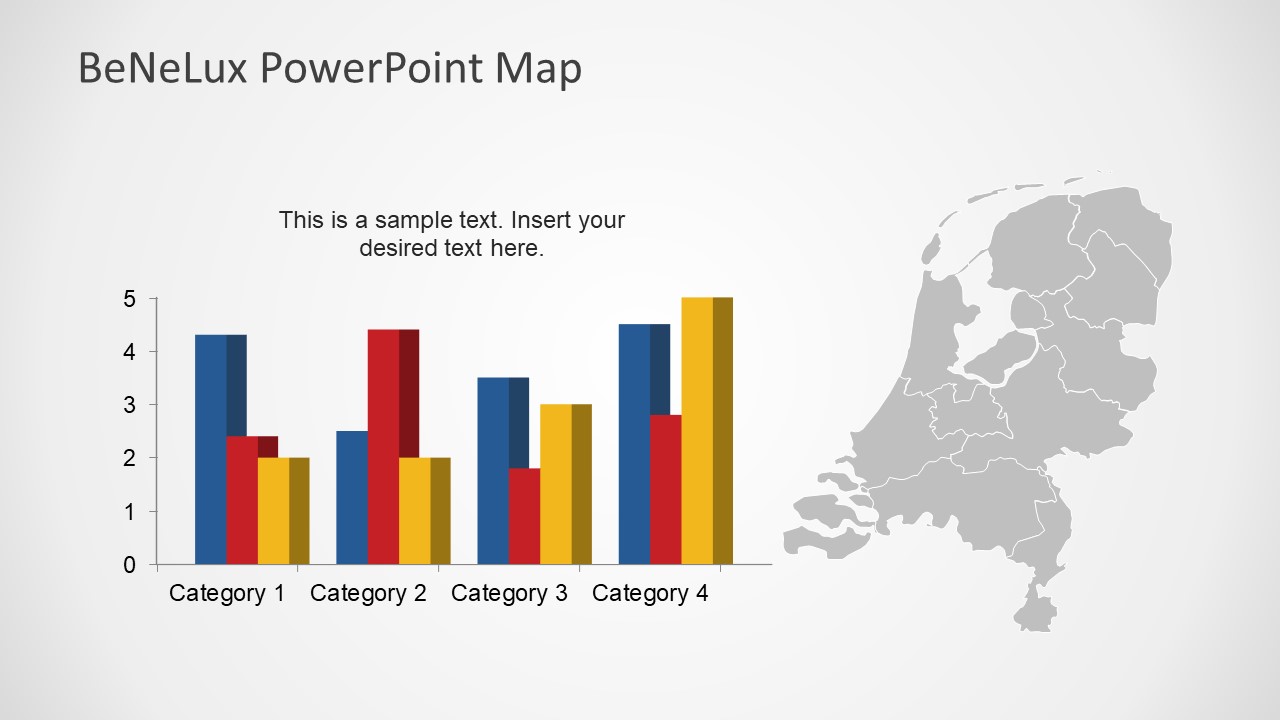
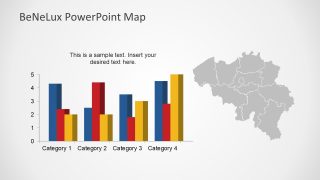
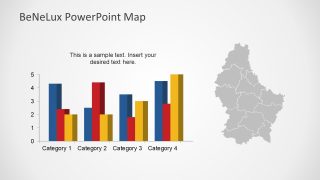
The Benelux Political Region PowerPoint Map also has bar charts of data driven feature. It helps in displaying demographic related survey report such as, literacy rate, health research and more. It is also useful to show market surveys of product or services as an overview of business opportunities. The users can easily edit and update the chart by entering value in excel sheet. To do so, simply select chart, click funnel-icon button and in the right bottom, click “select data”. Moreover, the colors and style of graph is also customizable by using the plus (+) button.


You must be logged in to download this file.
DOWNLOAD- Category
- Maps
- Rating

 Loading...
- Size
- 16x94x3
- Item ID
- 7484-01
- Colors
Subscribe today and get immediate
access to download our PowerPoint templates.