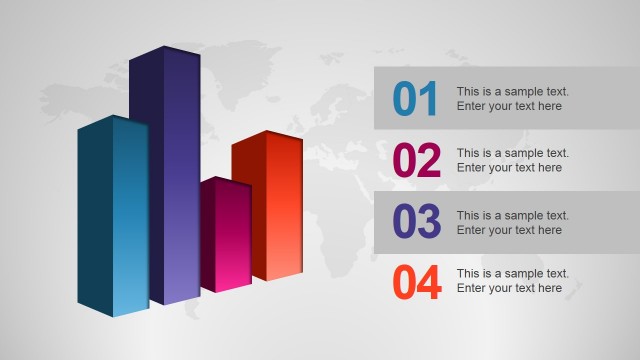
Creative Concept Chart with Steeple
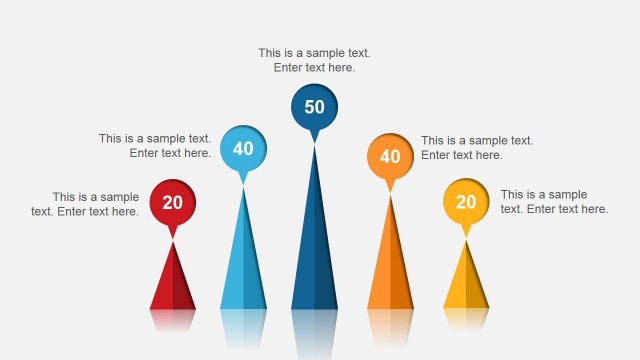
This creative concept chart with steeple for PowerPoint may be used as a visually-appealing substitute to a generic bar graph, which is most suitable to data concerning building and construction costs. Each bar is represented by a steeple with a different color, blue, orange, red, and black, with their varying heights equivalent to the statistical data.
Above each steeple PowerPoint graphic is a dialog box with the same color as the steeple, where the actual values for each element may be inserted. The steeples also have accompanying text placeholders where labels or descriptions may be inserted. All PowerPoint objects are 100% editable to suit the presenter’s needs and preferences.
Return to Animated PowerPoint Template.
Download unlimited PowerPoint templates, charts and graphics for your presentations with our annual plan.
DOWNLOADReturn to Animated PowerPoint Template.

