Slide 15 of 17 from AI Transformation Roadmap PowerPoint Template
AI & KPIs Slide with Data Presentation
AI KPIs and Tracking Overview
- Chart
- Line Chart
- Kpi Reporting Slide
- 16:9
- 100% Editable
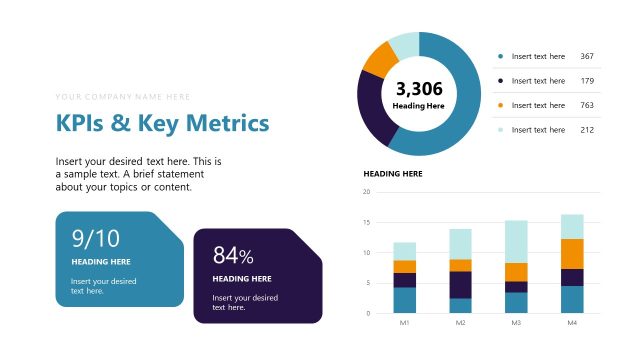
The AI KPIs and Tracking slide from the AI Transformation Roadmap PowerPoint Template offers a clear layout for presenting key performance indicators and tracking AI project progress. This slide template is designed for business presentations focused on strategic planning and KPI reporting, featuring editable shapes and charts that highlight financial and performance metrics over time. It integrates well into corporate presentation slide decks targeting data-driven decision-making and performance reviews.
What’s on This Slide
The layout features a title at the top center, stating 'AI KPIs and Tracking.' Below, there are four rectangular containers arranged in two columns. The left column contains two boxes with financial and performance metrics, while the right column has a bar chart with a heading above it. The chart displays a line graph with multiple data points across four years. Text placeholders are present for metrics and descriptions, with alignment primarily left-justified. The overall color scheme includes shades of purple and white, contributing to a structured visual hierarchy.
How to Use It
This layout serves as a performance tracking overview, ideal for presenting key performance indicators related to AI initiatives. It fits within a strategic presentation sequence, particularly after discussing project goals or objectives. This format is suitable for business scenarios where stakeholders need to review progress and metrics over time, making it effective for quarterly reviews or strategic planning sessions.
Text Placeholders & Capacity
Keep your copy within these limits so it fits without resizing. Node labels can accommodate about 3-4 words each.
| Placeholder | Count | Max characters (approx.) |
|---|---|---|
| Slide title | 1 | 30 |
| Item heading | 4 | 20 |
| Item body | 4 | 50 |
| Chart title | 1 | 30 |
| Axis label | 2 | 20 |
Slide Keywords
Download unlimited PowerPoint templates, charts and graphics for your presentations with our annual plan.
DOWNLOAD