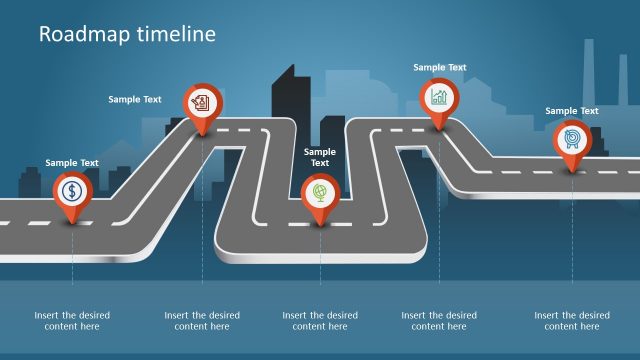
7 Steps Navigational Infographic Timeline Template
The 7 Steps Navigational Infographic Timeline Template is an animated presentation for time-tracking concepts. It is a horizontal timeline containing seven milestones in chronological order. These milestones give an infographic chart look using meaningful clipart icons. The PowerPoint timeline diagram is designed to turn a simple roadmap into captivating animation. The first slide summarizes milestones i.e. stages in a project or notable events. The additional slides of the animated timeline template will help users navigate through content each milestone in an appealing layout.
A timeline diagram is a graphical representation of the chain of events within a specific timeframe. These events can give an overview of past actions, present, or future planning. The summarized list of events is the milestones that can be a yearly report, deliverable, stage, or achievement.
The roadmap template is useful in project planning presentations. It can help define a high-level timeline for the team to understand the requirements at each stage in a project. Another use of the PowerPoint roadmap template is the performance reporting presentation. You can present annual reports about staff performance using a PowerPoint timeline to track the team’s progress.
The 7 Steps Navigational Infographic Timeline Template provides a unique zoom-in style slide show. It uses morph animation to illustrate the movement of seven milestones. It initially shows seven yearly milestones. However, you can edit the text to present project stages, sub-processes, and smaller goals. Discover our step-by-step guide on how to create a timeline in PowerPoint and Google Slides. Alternatively, check our collection of 7 steps PowerPoint templates.


