Slide 1 of 3 from 3D Pie & Bar Charts for PowerPoint
6096-01-pie-with-bar-chart-1
3D Pie and Bar Charts for PowerPoint
- Chart
- Pie Chart
- Context Slide
- 16:9
- 100% Editable
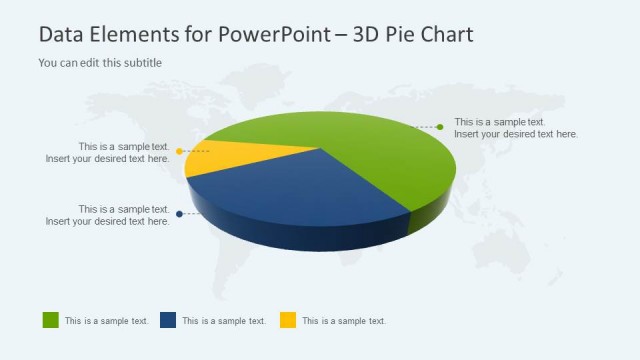
The 3D Pie with Bar Charts slide from the 3D Pie & Bar Charts for PowerPoint template offers a clear visual hierarchy for presenting sales performance and market share data. This slide layout combines editable shapes and vector icons within pie and bar charts, making it a practical choice for business presentations and pitch deck templates that require effective data visualization.
What’s on This Slide
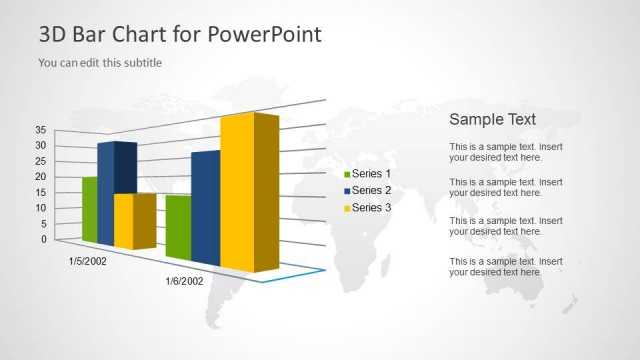
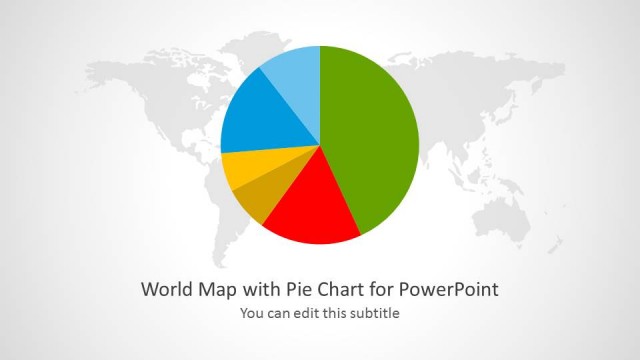
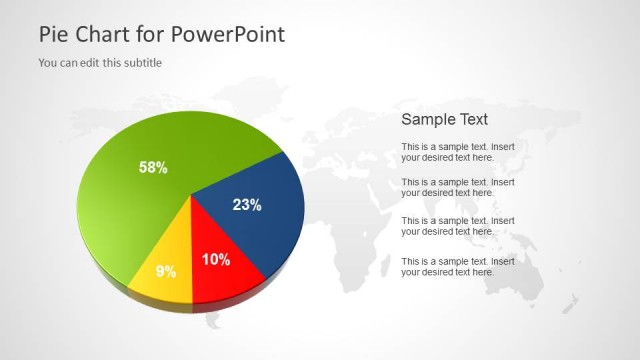
The layout features a 3D pie chart positioned on the left side, with segments in various colors including red, green, yellow, and blue. A set of vertical bar charts is located on the right, with three distinct bars in different heights and colors, including yellow and blue. The background is a solid blue with a faint world map outline. The title is centered at the top, and a subtitle placeholder is positioned below it. The overall composition balances the pie and bar charts, creating a clear visual hierarchy.
How to Use It
This layout serves as a data visualization tool, effectively combining pie and bar charts to present comparative data. It is suitable for scenarios such as sales performance reviews, market share analysis, or demographic breakdowns. Positioned early in a presentation, it can introduce key data points, making it ideal for reports or pitches that require a strong visual impact. The design allows for easy integration of various datasets, enhancing audience understanding of complex information.
Text Placeholders & Capacity
Keep your copy within these limits so it fits without resizing. Title slot is spacious, allowing for a longer title.
| Placeholder | Count | Max characters (approx.) |
|---|---|---|
| Slide title | 1 | 30 |
| Subtitle | 1 | 40 |
Slide Keywords
Download unlimited PowerPoint templates, charts and graphics for your presentations with our annual plan.
DOWNLOADReturn to 3D Pie & Bar Charts for PowerPoint.