Slide 1 of 1 from 2-Option Diagram Infographic PowerPoint Template
2-Option Diagram Infographic Presentation Slide Template
Two Option Comparison Diagram for Presentations
- Diagram
- Comparison Split
- Comparison Slide
- 16:9
- 100% Editable
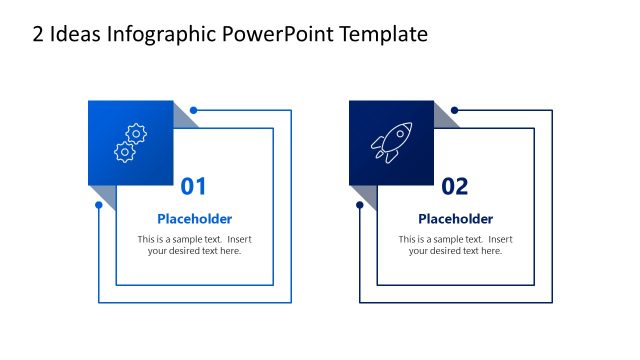
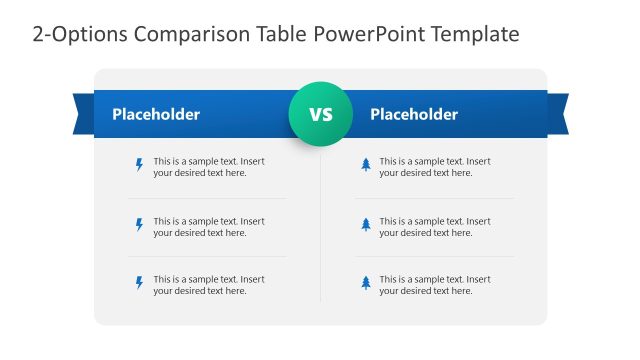
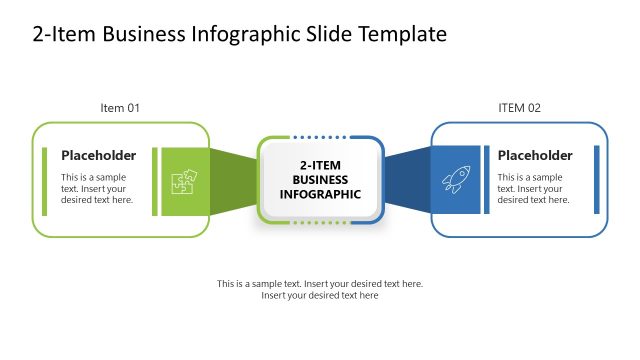
The Two Option Comparison Diagram from the 2-Option Diagram Infographic PowerPoint Template offers a clear layout for contrasting product features or project strategies. This slide template uses editable shapes and vector icons to visually separate options, enhancing business presentations and pitch decks with a professional, easy-to-understand comparison format.
What’s on This Slide
The layout features two rounded option cards positioned side by side, separated by a central connector. The left card contains a light bulb icon and the label 'OPTION 01' at the top, followed by a text placeholder aligned left. The right card displays a group icon with the label 'OPTION 02' at the top, also followed by a left-aligned text placeholder. The overall color scheme includes a dark blue outline for the left card and a light blue outline for the right card. The background is white, enhancing clarity and focus on the options presented.
How to Use It
This layout serves as a two-option comparison diagram, ideal for presenting alternatives in business decisions or project phases. It fits well in a presentation sequence after outlining a problem or need for choice. Scenarios include comparing product features, evaluating strategies, or deciding between project approaches. The clear visual separation of options aids in audience understanding and decision-making processes.
Text Placeholders & Capacity
Keep your copy within these limits so it fits without resizing. Node body slots can accommodate roughly 20-25 words each.
| Placeholder | Count | Max characters (approx.) |
|---|---|---|
| Slide title | 1 | 30 |
| Item heading | 2 | 15 |
| Item body | 2 | 100 |
Slide Keywords
Download unlimited PowerPoint templates, charts and graphics for your presentations with our annual plan.
DOWNLOAD